


· 28 min read
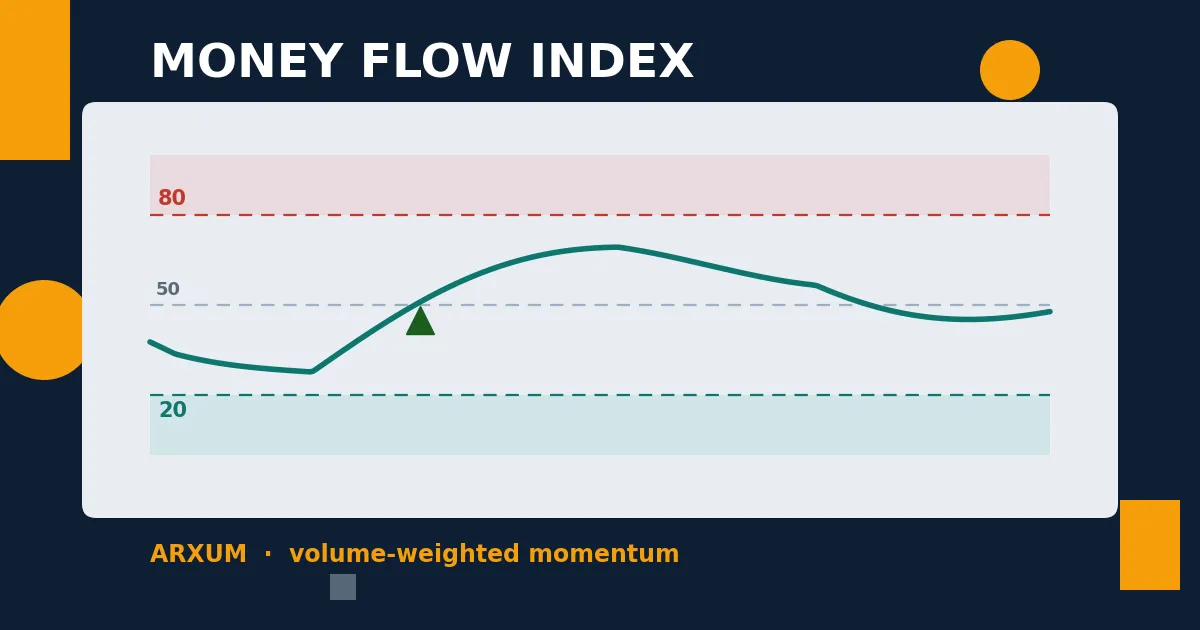
Money Flow Index: Where the Volume Edge Is Real, and Where It Isn't
We tested the Money Flow Index across eight years on gold, silver, Bitcoin and EUR/USD. The MFI money-flow pullback pays, and the volume edge is genuine where the volume is real. Full numbers, real charts.