What Bollinger Bands are
Let’s start with what the searcher came for. Bollinger Bands are three lines you add on top of a price chart. John Bollinger built them in the early 1980s, and the standard settings have barely moved since.
- The middle band is a 20-period simple moving average. That is just the average closing price over the last 20 candles, a slow line that tracks the centre of recent price.
- The upper and lower bands sit two standard deviations above and below that middle line. Standard deviation is a measure of how spread out recent prices are. When price has been jumpy, the number is large and the bands push wide. When price has been calm, it shrinks and the bands close in.
That breathing is the whole idea. The bands are a volatility gauge wrapped around an average. They do not predict direction on their own. They tell you how much room price is using right now, and they frame three classic reads.
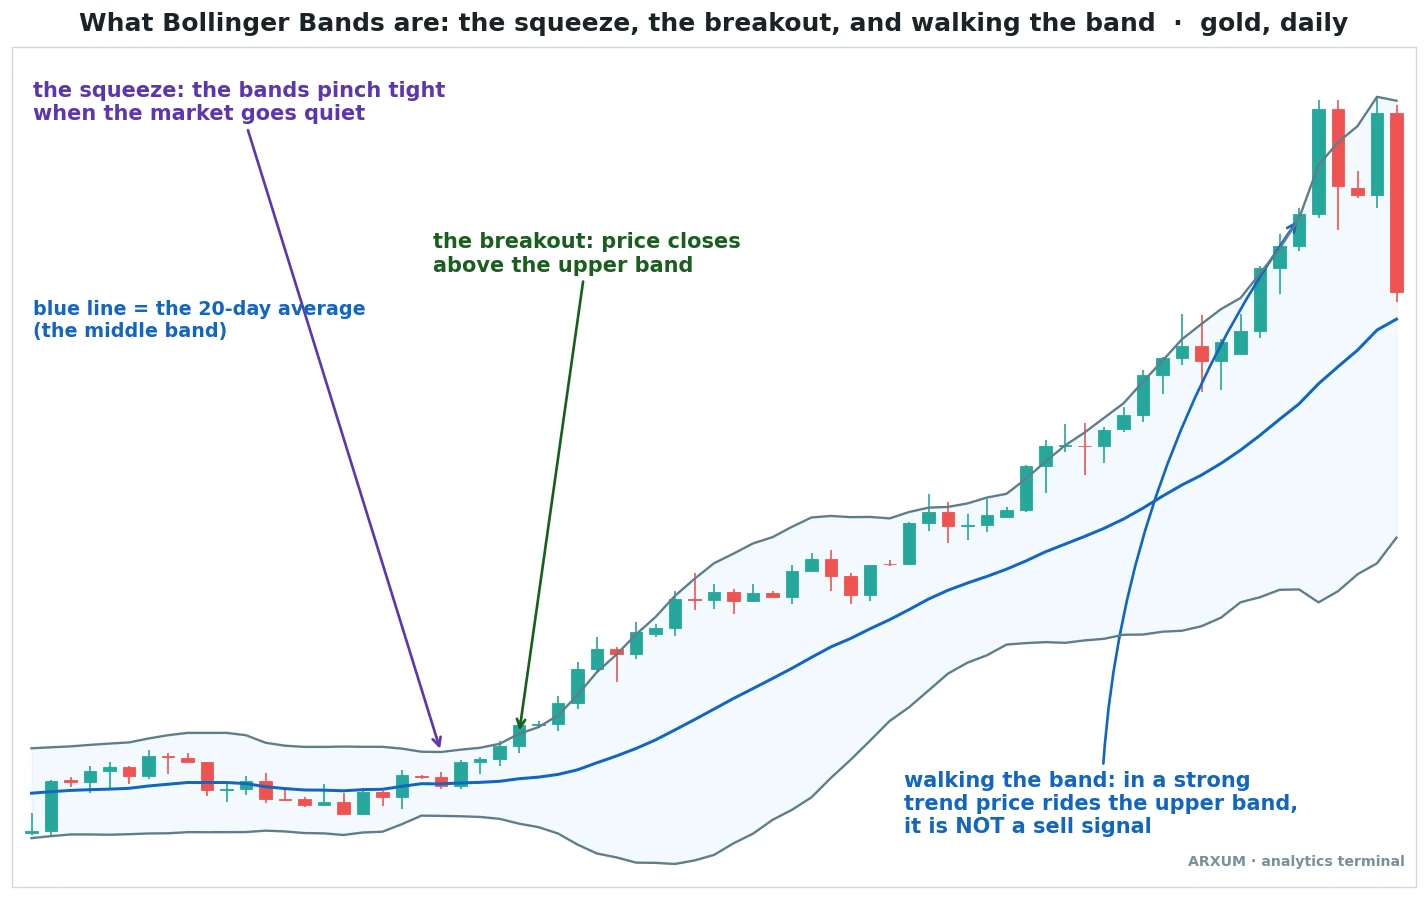
Look at that chart left to right and you have seen all three things Bollinger Bands are used for. The bands pinch tight while gold goes quiet. Price closes above the upper band and the channel blows open. Then price climbs the upper band for weeks. Three reads, one chart. The rest of this guide takes each one and asks the only question that matters: is it worth trading?
A quick note on what this guide is. We did the testing already, so this reports what the data shows rather than selling you a system. If you want the full step-by-step method, with the rules and the order tickets, that lives in the companion Bollinger Bands strategy guide. This piece is about understanding the indicator and what each read is honestly worth.
The squeeze: the bands pinching tight
The squeeze is the read worth getting excited about. When the upper and lower bands choke in to their narrowest in months, volatility has dried up and the market is coiling. Calm stretches do not last. They tend to end in a fast move.
The squeeze does not tell you which way. That is the catch every beginner trips on. A pinch says a move is loading, not whether it fires up or down. You wait for price to close outside a band, and that close picks the direction for you.
Here is the part most articles skip: how good is it? We ran the squeeze breakout on gold across eight years, buying the close above the upper band out of a genuine pinch. On the daily chart it was the standout read in the whole study.
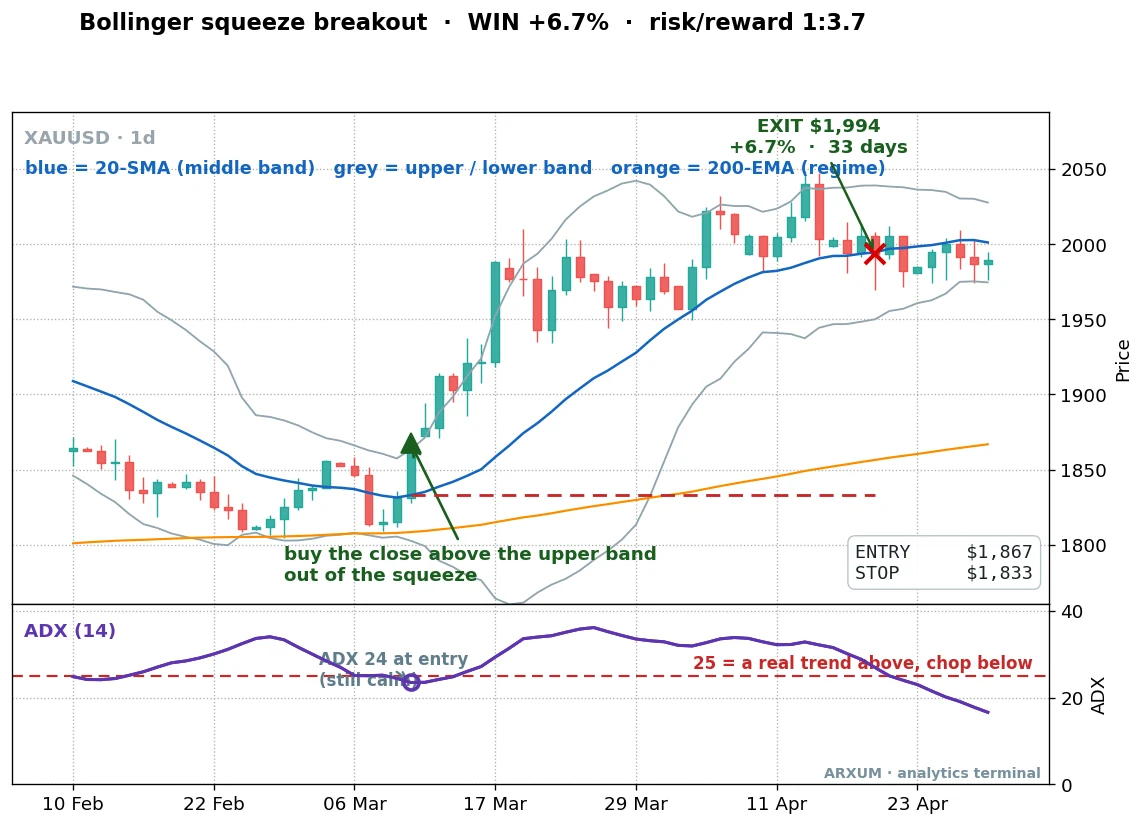
Price ground sideways while the bands pinched. One candle closed above the upper band, and gold ran for a month. The stop sat at the middle band, close under the coil, so a normal move turned into a 1:3.7 trade. The risk/reward, written 1:X, is the reward measured against the risk: the 1 is the distance from your entry to your stop, the X is how many times that the trade made back. A 1:3.7 made back roughly three and a half times what it put at risk.
Across the full eight years the daily squeeze breakout on gold posted a profit factor of 2.27. Profit factor is the whole strategy’s dollars won divided by dollars lost, so above 1 it made money and 2.27 means it won about $2.27 for every dollar it gave back. That is a strong number for a single indicator read.
The catch is the confirmation. A squeeze that breaks and then fizzles back inside the range is the one that stops you out. The filter the data rewards here is not volume. It is trend strength, read off the ADX line in the panel below the price. ADX climbing through 25 means the break is turning into a real trend rather than a fakeout. On the 4-hour chart the squeeze alone scored a profit factor of 1.32; demanding ADX above 25 lifted it to 1.72.
So the squeeze read, in one line: the pinch warns you, the close outside the band gives direction, and ADX rising through 25 tells you the break is real. That is the highest-quality thing Bollinger Bands do.
Walking the band: riding one band in a trend
This is the read beginners get backwards. In a strong trend, price will sit on or near one band for candle after candle. New traders see “price is at the upper band, it must be overbought” and try to fade it. That is how you hand your account to a trend.
In a genuine uptrend, repeated touches of the upper band are a sign of strength, not a warning. Price walking the band is the trend showing you it has not finished. The right read is to ride it, not fight it.
We tested band riding as a real setup on gold: buy when price pulls back to the middle band and then closes back above it in an uptrend, ride until it closes back under the middle band. On the 4-hour chart over eight years it was the workhorse of the whole study.
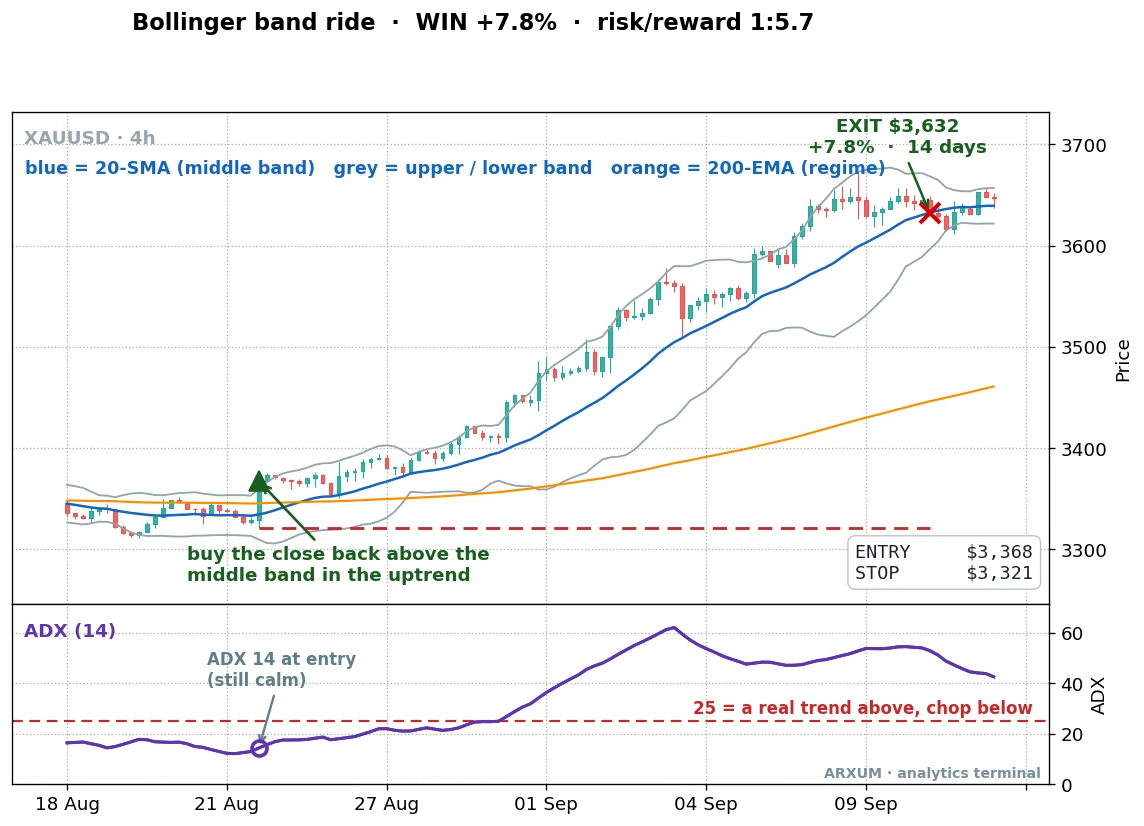
The shape is the point. A small, fixed risk under the pullback, and an open-ended ride while price walks the band. Across eight years on gold’s 4-hour chart this read made a profit factor of 1.64 and turned $1,000 into about $2,162, with the deepest dip in the account around 9%. Simply holding gold returned far more in this bull run, but it also sat through a 27% drawdown to do it. The band ride kept roughly a quarter of that pain.
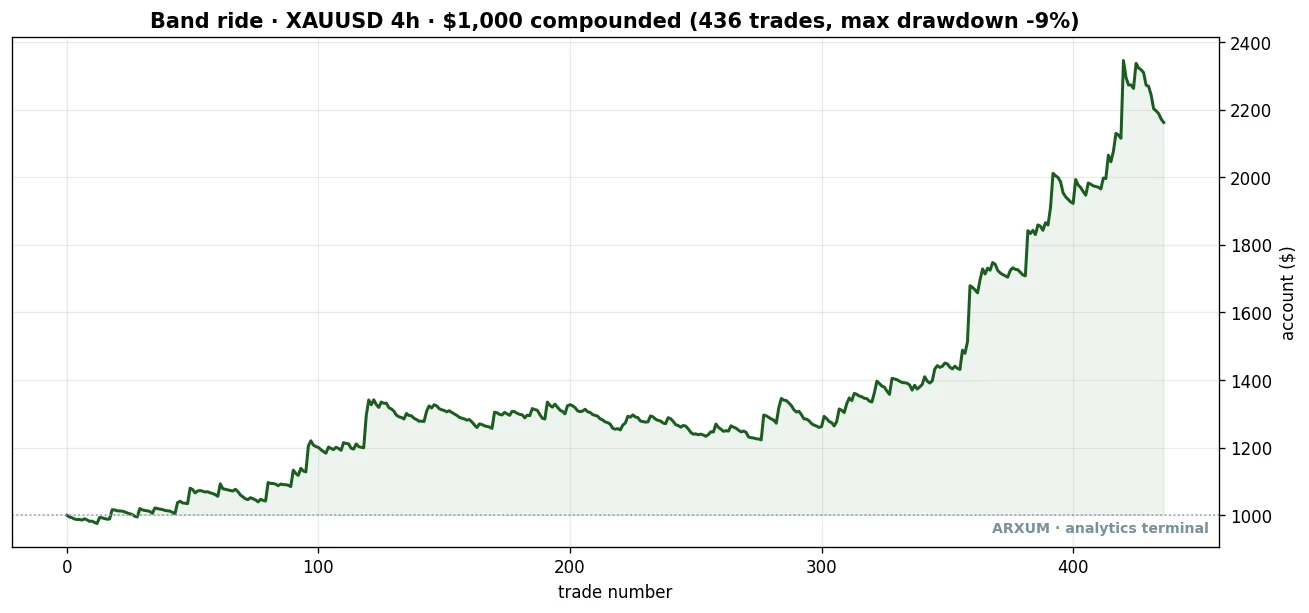
Here is the full record behind that curve.
| Trades | 436 |
| Win rate | 27% |
| Average win / loss | +1.8% / −0.4% |
| Reward-to-risk | 1:4.5 |
| Profit factor | 1.64 |
| Max drawdown | −9% |
| First half / second half PF | 1.85 / 1.19 |
| $1,000 compounded | → $2,162 |
A 27% win rate that still more than doubled the account is the read in one number. You lose small and often, and a handful of big band-rides pay for all of it. It also held in both halves of the data, which is the test most setups quietly fail.
One surprise the data handed us: the volume filter, which helps so many breakout setups, actually hurt the band ride. The solo read scored 1.64; demanding heavy volume on the entry dropped it to 1.50. What lifted it instead was momentum. Filtering for RSI above 55 or a positive MACD histogram pushed the profit factor to 1.79. The confirmation a read needs is discovered from the data, not bolted on by habit.
The bounce: the band touch most courses teach
Now the read every beginner course leads with, and the one the data is harshest on. Price drops to the lower band, you buy, expecting a snap back to the middle. It sounds clean and it feels intuitive. It barely works.
The logic treats the lower band as a floor. It is not. The band is a stretched rubber band, and in a trend a tag of the lower band is often the start of a deeper flush, not a bounce. You end up catching a falling knife in a market that wants to keep going without you.
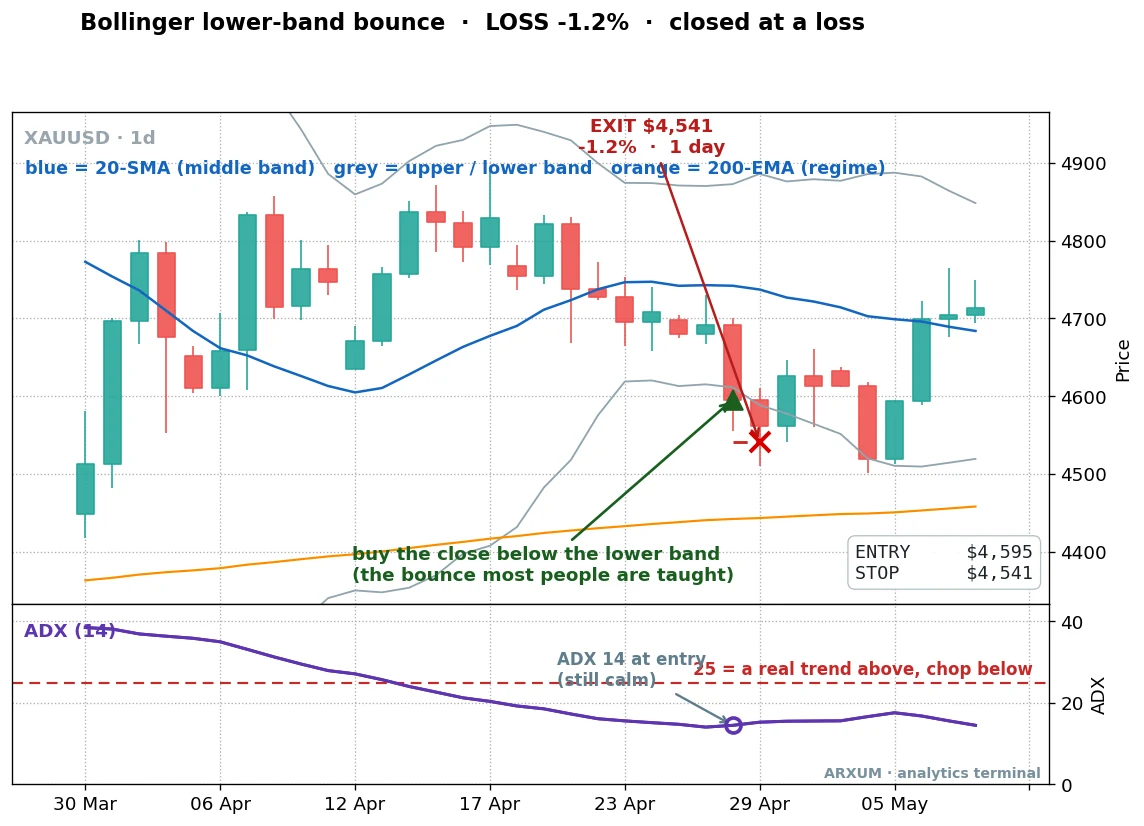
That is the trap in one chart. The band touch looked like a bargain. Price did not care. On gold’s daily chart over eight years, the lower-band bounce posted a profit factor of 0.87, an actual loser. On the 4-hour it was 1.03, a hair above breakeven and not worth the screen time.
The bounce is not useless everywhere. Its one habitat is a flat, range-bound market, where price genuinely oscillates between the bands. EUR/USD spent these eight years going essentially nowhere, the ideal home for mean reversion. Even there the read had the highest win rate in the whole study, 52.6%, and still came out at a profit factor of 0.91. It won more often than it lost and still bled, because the wins were tiny and the losses, when the range broke, were not.
That gap is the lesson of this whole guide. A high win rate feels like an edge and is not one. The bounce wins small and often, then a range break takes it all back.
What each read is actually worth
Here is the whole study on one screen. The bars are profit factor, dollars won per dollar lost, with 1.0 marking breakeven.
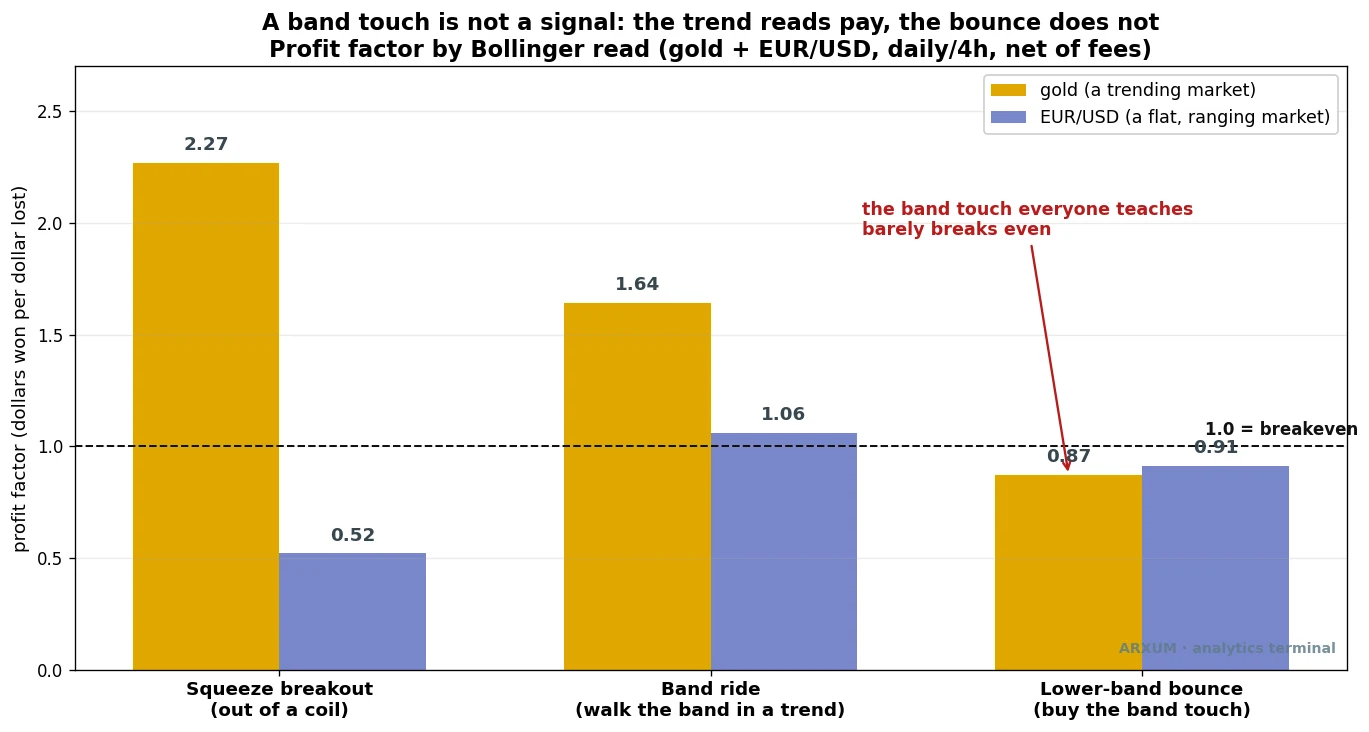
Read it left to right and the message is clear. The squeeze breakout and the band ride both clear breakeven comfortably on gold, the trending market. The lower-band bounce sits below the line on both assets. A band touch, the thing most beginners are taught to trade, is the weakest read the indicator offers.
The reads also split by market. Gold trends, so the trend reads pay and the bounce loses. EUR/USD ranges, so the bounce is at least playable, while the squeeze breakout falls apart on it (profit factor 0.52). The indicator does not change. The market under it does, and that decides which read is alive.
| Read | Best market | What the data says |
|---|---|---|
| Squeeze breakout | Gold, trending | The strongest signal, PF up to 2.27 |
| Band ride | Gold, trending | The workhorse, PF 1.64, holds out of sample |
| Lower-band bounce | EUR/USD, ranging | High win rate but PF under 1, barely playable |
If you trade Forex rather than metals, the honest takeaway is not “the bands are broken.” It is that you need a clean trend to use the strong reads. Pick a pair or a session that is actually trending and the band ride travels; force the bounce on a fake-flat pair and it bleeds. The companion Bollinger Bands strategy walks the band ride through entry, stop and target if you want to put it to work.
How to use Bollinger Bands settings
The settings question comes up constantly, so here is the short version. Use 20 and 2. The 20 is how many candles the middle average covers; the 2 is how far the outer bands sit from it in standard deviations. That default was chosen because it holds roughly 95% of recent price inside the bands across most markets and timeframes. Every number in this guide came from those settings.
Two adjustments are legitimate, and only two.
- Longer averages for slower trading. A 50-period middle band on the daily or weekly smooths the line and widens the bands, which filters intraday noise. You get fewer signals, but they line up with multi-day moves. The cost is that entries come later.
- Wider bands for volatile assets. Bumping the deviations from 2 to 2.5 on gold during a strong trend or on crypto cuts down the false “overbought” tags. During gold’s run the standard 2-deviation upper band got breached and recovered constantly; the wider setting kept you in the trend longer.
That wider-band case is worth seeing, because the gap is bigger than it sounds. We drew both settings on the same stretch of gold’s late-2025 run, the standard 20/2 bands and a wider 20/2.5.
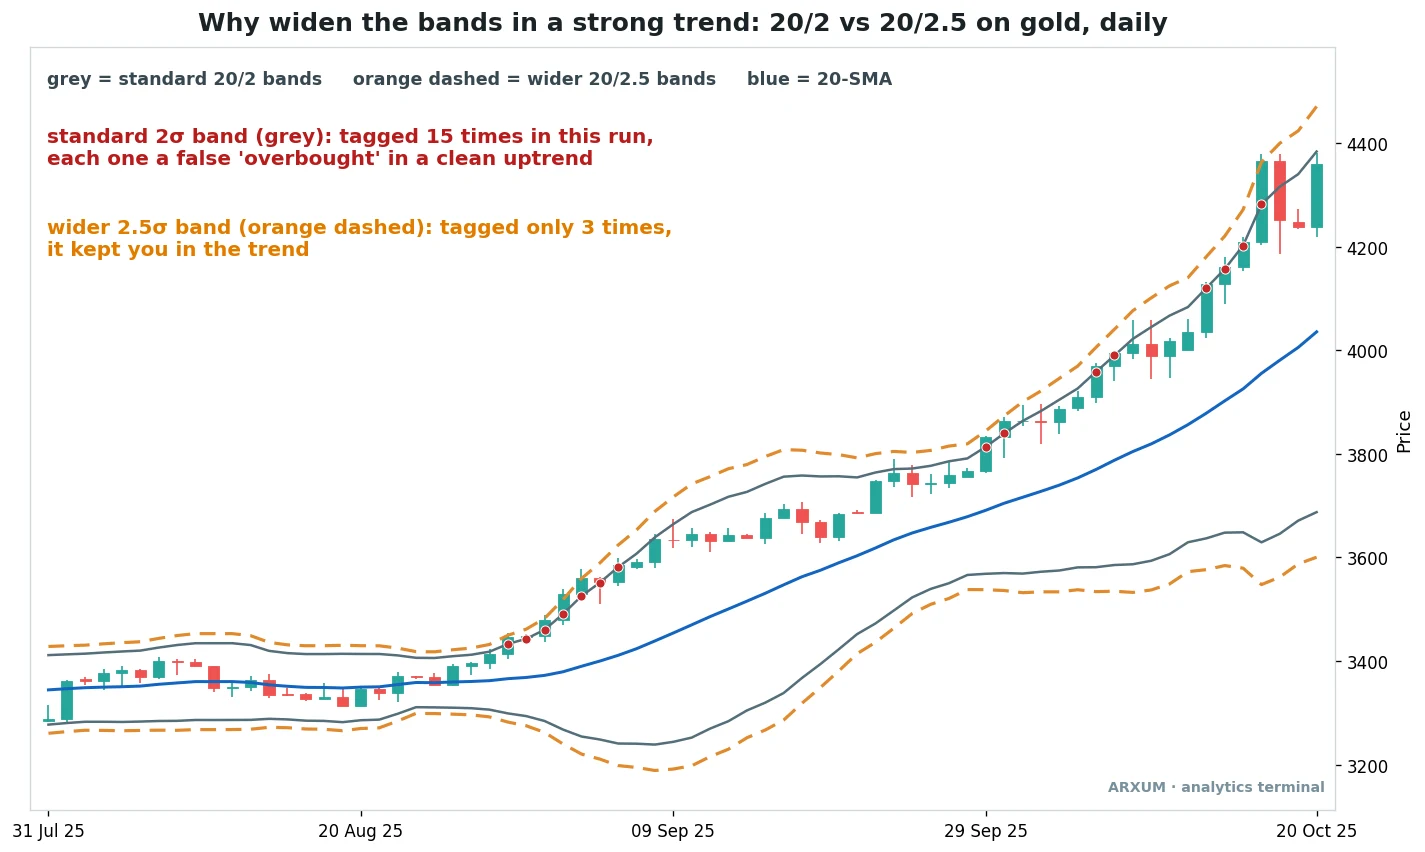
Over that single trend the standard 2-deviation upper band was tagged 15 separate times. Read each touch as an “overbought” sell and you were shaken out of a clean uptrend again and again.
The wider 2.5-deviation band was tagged just 3 times across the same stretch, so it kept you riding the move instead of fighting it. That is the whole case for widening the bands on a hard-trending or naturally jumpy market: it stops the indicator crying wolf.
The trade-off is real, though. The wider band sits further from price, so a genuine reversal takes longer to show up. Reach for 2.5 when an asset trends hard or whips around, gold in a run or crypto; leave it at 2 everywhere else.
Changing either is two clicks. Every charting platform exposes the same two inputs when you add the indicator, the period and the deviations. Type 50 into the first to slow the line down, or 2.5 into the second to widen the bands. Nothing else moves, and you can flip them back just as fast.
What to avoid: going below 10 periods. At that point the bands react to single candles instead of real volatility shifts, and you trade noise. And resist the urge to tune the settings to whatever looks perfect on the last six months. Settings that fit one chart usually fail on the next.
The timeframe decides it
One read that runs through every number above: the timeframe is not a detail, it is the difference between an edge and a coin flip. Drop these reads to the 1-hour chart and most of them fall apart. The bands whip around, you get chopped on false tags, and trading costs eat what little edge survives. On gold’s 1-hour over a recent year the bounce lost money and the band ride scraped a 1.20 profit factor against the 1.64 it earned on the 4-hour.
If you take one practical rule from this guide, make it this: trade Bollinger reads on the 4-hour chart or higher. The 1-hour looks busier and feels more active, and that activity is mostly a tax.
Direction matters just as much, and the 200-period moving average is the simplest way to read it. Above a rising 200-EMA the market is in an uptrend, so you take the long reads. Below a falling one it is a downtrend, so the same logic flips to the short side. Every short read in our test lost money on gold’s bull run, exactly what you would expect from fighting a strong trend. The bands help you trade inside the market’s direction; they do not override it.
Common mistakes with Bollinger Bands
The same handful of errors cost most traders, and the data above points right at them.
- Treating a band touch as a signal. The upper band is not resistance and the lower band is not support. They are statistical edges, and in a trend price can sit outside them for weeks. Check the slope of the middle band before you read a touch as a reversal.
- Trading the squeeze as a direction. A squeeze tells you a move is loading, not which way. Entering before the close outside the band is a coin flip. Wait for the break.
- Fading a band walk. Selling every tag of the upper band in an uptrend was the worst-performing idea in the study. A band walk is the trend confirming itself.
- Ignoring the middle band. Most traders stare at the extremes and forget the 20-day average is the magnet price keeps returning to. In a trend it is your trailing reference; in a range it is your target.
- Tuning the settings to the last chart. The 20, 2 default holds up precisely because it was not fit to any single market. Custom settings that look perfect on six months of one pair tend to fail out of sample.
A note on using this in your own trading
If you decide to trade any of these reads, treat the bands as one input, not a system on autopilot. The reads here are tools, and which one is alive depends on whether the market is trending or ranging and which way. No mechanical read is a permanent edge; if it were, nobody would publish it. The honest expectation is an edge that shows up over many trades, not on every one.
That means losing streaks are normal, especially with the band ride, where a 27% win rate guarantees long runs of small losses before a trend pays for them. A few rules keep that survivable:
- Risk a small, fixed slice per trade, around 2%, so no single loss matters and no streak ends you.
- Use a circuit-breaker. Three to six losses in a row and the regime may have shifted, so step back and check the market is still trending before you keep trading the same read.
- Keep the psychology plain. Do not chase a band touch because it looks oversold, do not revenge-trade a stopped-out bounce, and do not size up after a big band-ride win.
Put a real number on that 2%. On a $500 account it is $10 of risk per trade. If a gold band-ride entry sits about $15 above its stop, the smallest common size, a 0.01 lot, risks roughly $15 on that move, a touch over your limit. You do not widen the stop or skip the read to fix that. You size to it: a micro or cent account lets you dial a gold stop down to $10, or you take the same setup on a lower-priced instrument where a 0.01 lot risks less. The 2% stays fixed; the lot size and instrument flex to respect it.
If your live results run materially worse than the data here over a real sample, do not panic over one bad week, but do not ignore a sustained gap either. Step back and check whether the market has changed character. The data and the honest scope are the safety here, not a wall of disclaimers. You can chart all of this on a free TradingView account, and only risk money you can afford to lose.
Where to go from here
Bollinger Bands are a volatility frame, and they read best paired with the right partner. For the full method behind the band ride and the squeeze, with entries, stops and order tickets, go to the Bollinger Bands strategy guide. If you want the momentum reads that lifted the band ride, start with the RSI indicator and the MACD indicator. The Keltner channel does a similar job to the bands with a steadier outer line, and if the lower-band bounce interests you, read how mean reversion trading only works in the right market. To make sense of every 1:X on the charts above, the risk-reward ratio explainer covers it.
Whatever you trade, the rules that carried this whole study are the same: the 4-hour chart or higher, the 200-EMA to pick your side, and the read that matches the market. Match the tool to the market and the bands earn their place on your chart.
FAQ
What are Bollinger Bands in plain terms?
Do Bollinger Bands actually work?
What is a Bollinger Band squeeze?
What does walking the bands mean?
What are the best Bollinger Bands settings?
How do you use Bollinger Bands?
Should I buy when price hits the lower band?
What is the best timeframe for Bollinger Bands?
Can Bollinger Bands be used for crypto and Forex?
How much money do I need to start?
What do the key terms mean?
🌍 Our recommended brokers

Quant Researcher & Systems Builder
Quantitative researcher who builds the automated systems behind Arxum strategy testing. Works in Python and Pine Script, using AI alongside classic backtesting to validate strategies on years of real data.