What a double top and double bottom look like
Before any numbers, here is the shape both patterns draw. Double bottom on the left, double top on the right, the way a textbook lays them out.
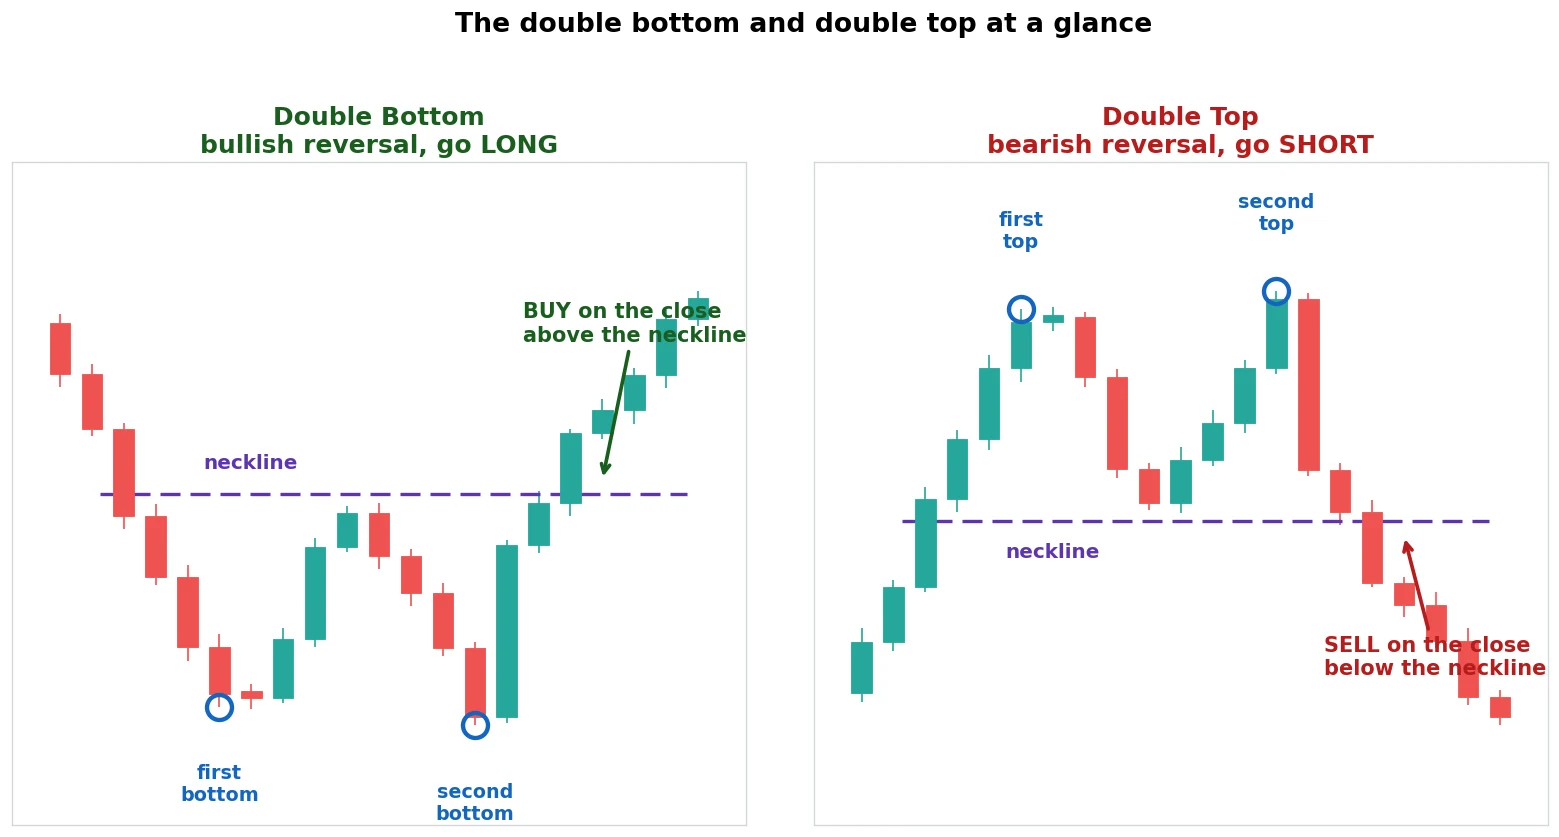
A double bottom is price hitting a floor twice. It drops to a level, bounces, comes back down to almost exactly the same level, then turns up. Join the two lows and you have the support. The high of the bounce in between is the neckline. When price closes above that neckline, the pattern is confirmed and you buy.
A double top is the same idea flipped. Price pushes to a ceiling twice, fails both times, and rolls over. The two highs mark the resistance, the low between them is the neckline, and a close below it confirms the turn down. You sell.
The logic is identical either way. A level got tested twice and held, so the side defending it has won, and price tends to move away from it. That two-test structure is what separates a real reversal from a single random spike. Most guides to double top chart patterns stop right there, with the shape. The shape is only half the story.
The real question: does the market actually reverse?
Here is the catch the textbook drawing hides. Both of these are reversal patterns. They are bets that a trend is about to turn. So they can only pay you in a market that genuinely turns.
Think about what each one needs. A double bottom asks a falling market to stop falling and head back up. A double top asks a rising market to stop rising and roll over. If the underlying market doesn’t reverse, if it just keeps trending, the pattern fires and then gets run over.
That gives us the one rule the whole piece turns on:
Double tops and bottoms pay on markets that swing both ways, and fail on markets stuck in a strong trend.
That is not a flaw in the pattern. It is the nature of a reversal signal. So instead of testing it on whatever was popular, we picked the test by behaviour. We needed a market that actually cycles, and one that didn’t, to see the difference.
The split, on one chart
This is the chart the whole thesis turns on. It scores both patterns, double bottom and double top, by profit factor across four markets.
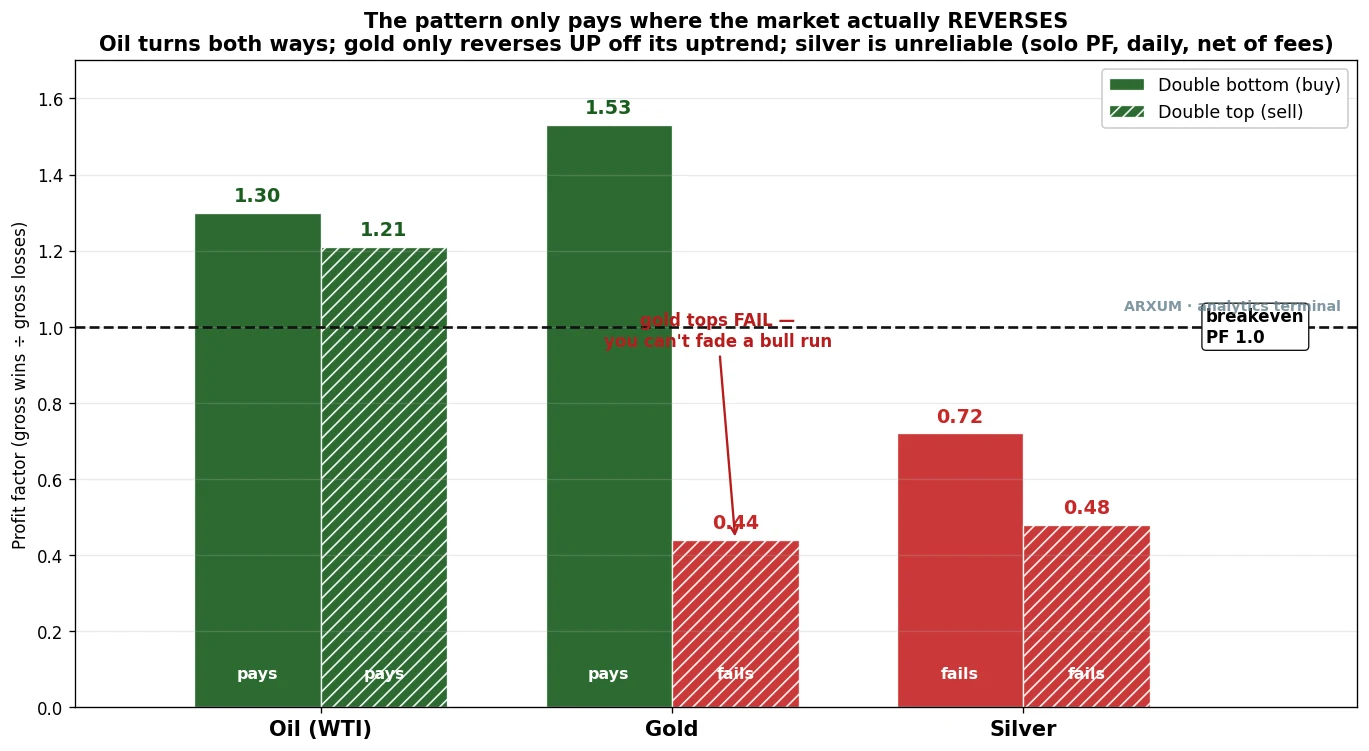
A quick word on the metric, so the bars don’t trip you up. Profit factor is total dollars won divided by total dollars lost across every trade. Above 1.0 the pattern makes money, below 1.0 it bleeds, and 1.5 means you won a dollar fifty for every dollar you gave back. Read the bars against that dashed line at 1.0.
Now read the split.
- Oil reverses both ways. Its double bottom cleared the line at 1.30 and its double top at 1.21. A cyclical market turns up off lows and down off highs, so both sides of the pattern had something real to catch.
- Gold is a split personality. Its double bottom paid at 1.53, but its double top failed hard at 0.44. Gold spent the eight years grinding higher, so buying its dips worked while fading its tops fought the trend and lost.
- Silver failed both sides. Same metals family as gold, but without gold’s clean bottoms. Both bars sit well below the line.
The finding in one line: oil pays both ways, gold pays only on the side that agrees with its trend, and silver doesn’t pay at all. The pattern didn’t change between markets. The market’s behaviour did.
That is why oil leads this piece, with gold as the warning sitting right behind it.
The rules, written down
Here is the double bottom, the long side, as a mechanical checklist. Oil leads, so read it with oil (WTI) in mind.
- Two bottoms: two swing lows at roughly the same price, within about 2.5% of each other.
- Reversal first: price must have been falling into the base. A double bottom is only a double bottom if it reverses a prior downtrend. Two lows in the middle of an uptrend are just a pullback, not this pattern.
- Neckline: the high of the bounce between the two lows.
- Entry: buy when a candle closes above the neckline. A close, not a wick poking through.
- Stop: below the second low, with a small buffer.
- Target: the height of the pattern, the neckline minus the bottoms, added on top of the neckline. The classic measured move.
- Costs: real spread and fees per market come out of every trade.
Here is the whole checklist as one picture, the way a textbook draws it. This is the ideal the real charts further down are measured against.
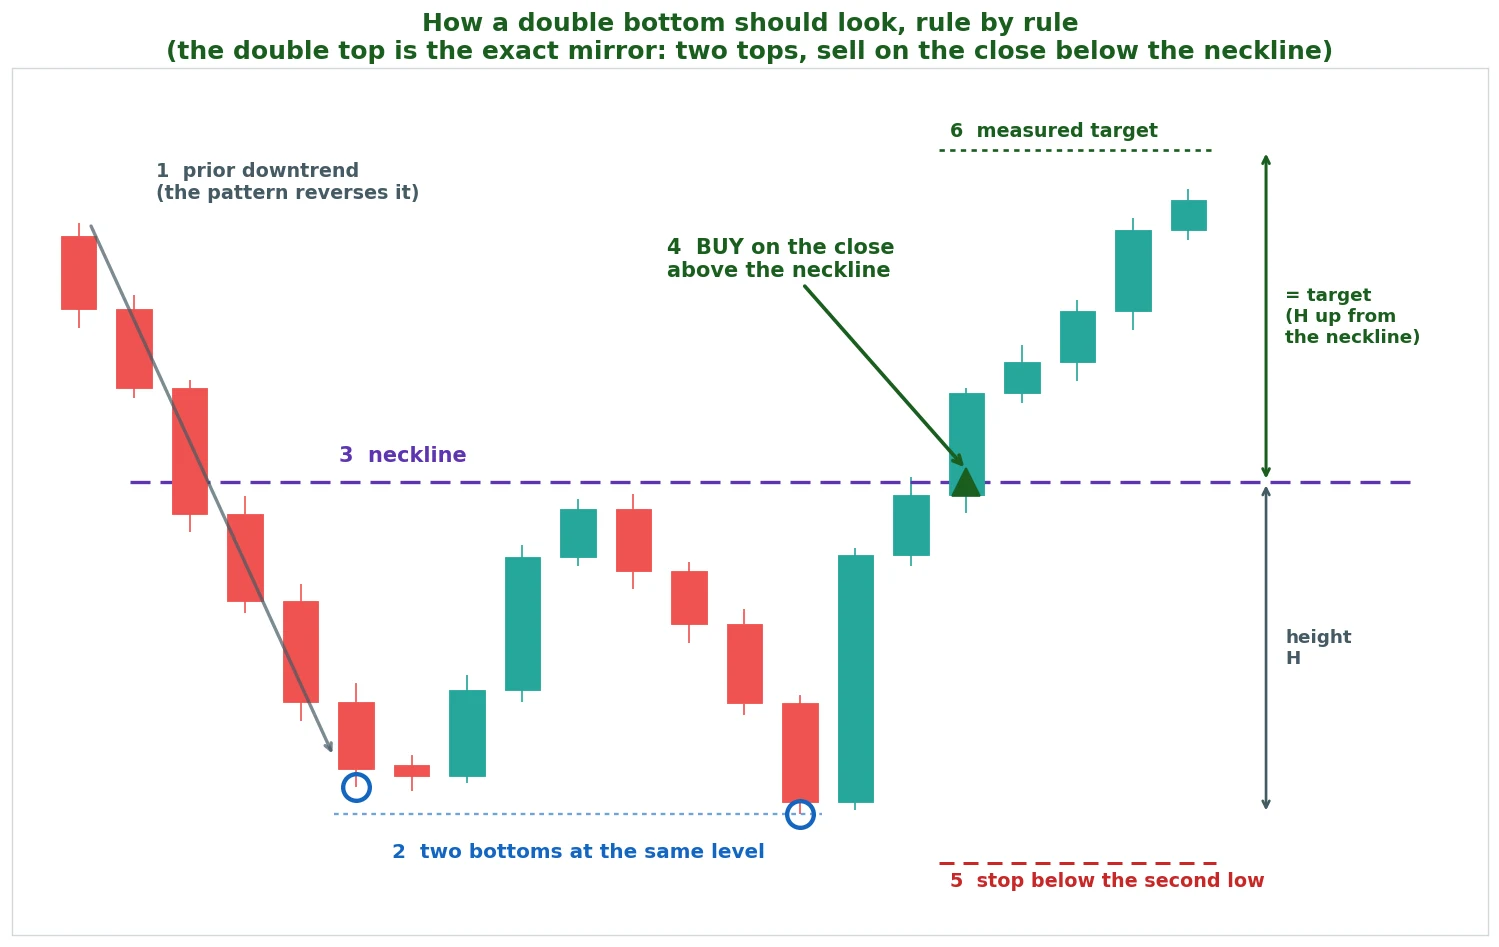
The double top is the exact mirror. Two highs at one level, a neckline at the dip between them, sell on the close below it, stop above the second high, target the pattern height projected down. And it needs a prior uptrend to reverse, the same way round.
That is the whole system on paper. The interesting part is what eight years of oil candles did to it.
A double bottom on oil, start to finish
Here is one of these trades on oil (WTI), with every part of the method on the chart. Read it as the anatomy of the setup.
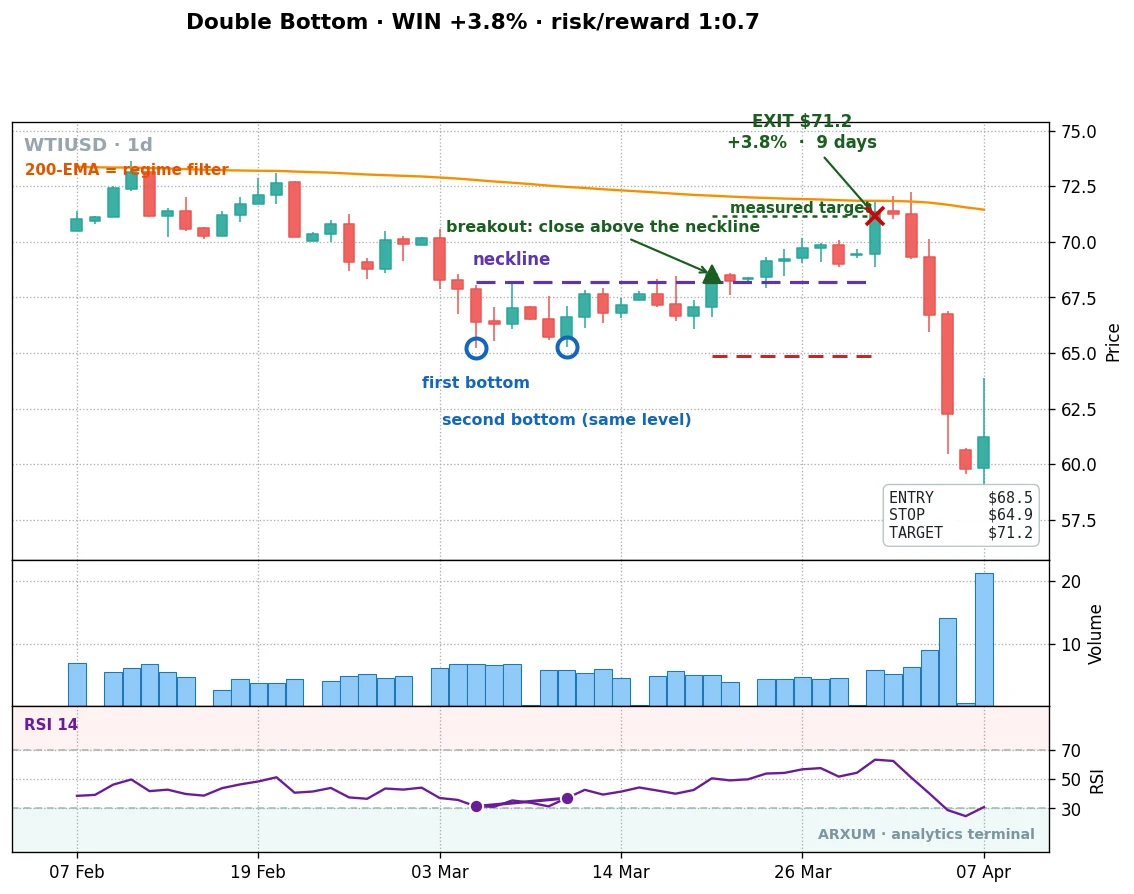
Read the chart left to right and the story is clean. Price was sliding, the 200-day line pointing down, a market in a downtrend. Then it put in a first low, bounced, and came back to almost exactly the same level for a second low. Same floor, tested twice, the selling unable to push lower.
The high of that bounce in between is your neckline. Draw it flat across. When a candle closes above it, the buyers have taken control and the pattern is live.
- Entry: $68.5, on the close above the neckline.
- Stop: $64.9, below the second bottom. The gap from entry to stop is your risk on the trade.
- Target: $71.2, the pattern height projected up from the neckline.
- Result: target hit 9 days later, a 3.8% gain.
Look at the reward against the risk on that ticket, though. The stop sat $3.6 below entry, the target $2.7 above it. The reward was smaller than the risk, a ratio of about 1 to 0.7. That feels backwards, and your instinct to flag it is right. It isn’t a flaw. This pattern makes its money a different way, which a later section explains.
A bigger oil winner
The anatomy trade was a tidy small one. Here is the edge paying off properly, same market, same rules.
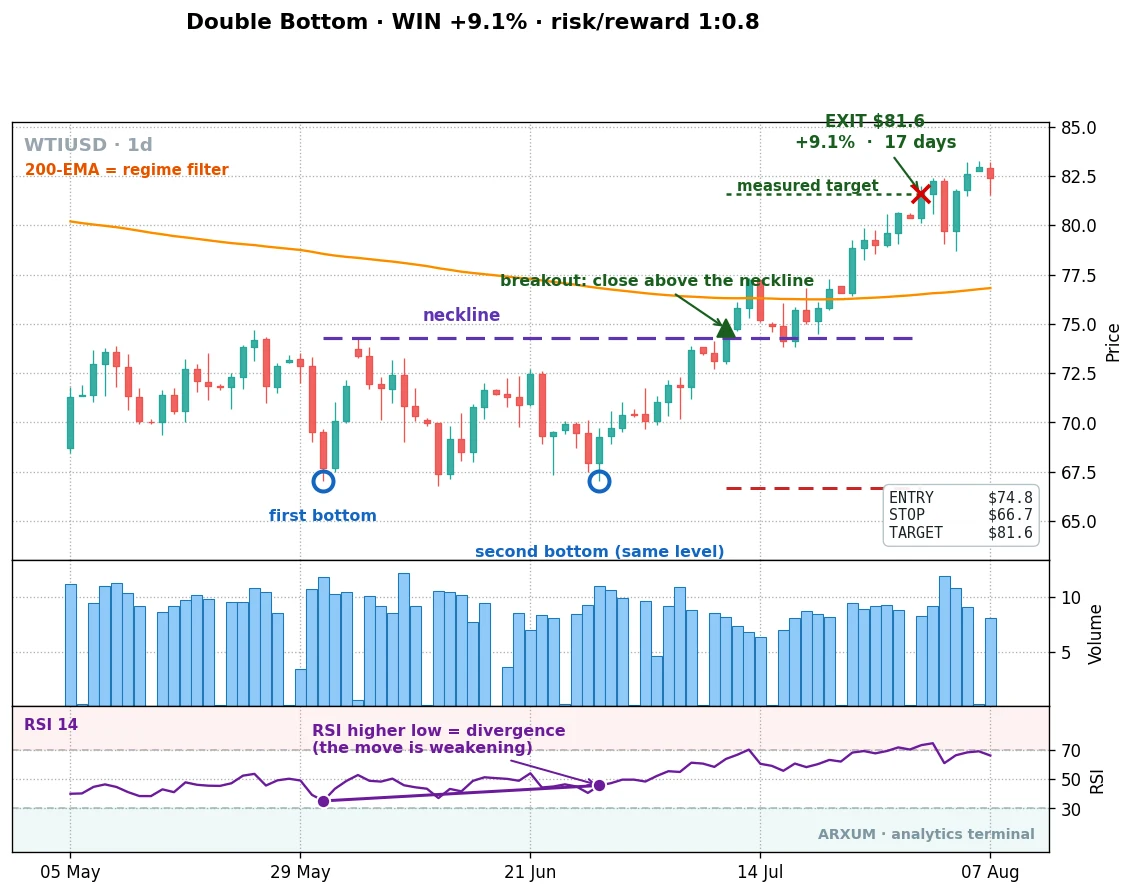
Same shape, bigger base, bigger payout. Price spent weeks carving two lows at one level after a slide, then broke the neckline and ran. The entry came at $74.8 on the close through the neckline, the stop went below the second bottom at $66.7, and the measured target sat up at $81.6. Price reached it 17 days later for a 9.1% gain. This one also carried a real RSI divergence into the second low, the bonus tell the next section covers.
The rule of thumb here: the taller the base between the two bottoms, the larger the measured move, because the target is projected by the height of the pattern. A wide, deep double bottom that breaks out cleanly is the one worth waiting for.
A quick word on divergence
There is one extra tell worth knowing, and it deserves a single plain section because it shows up rarely.
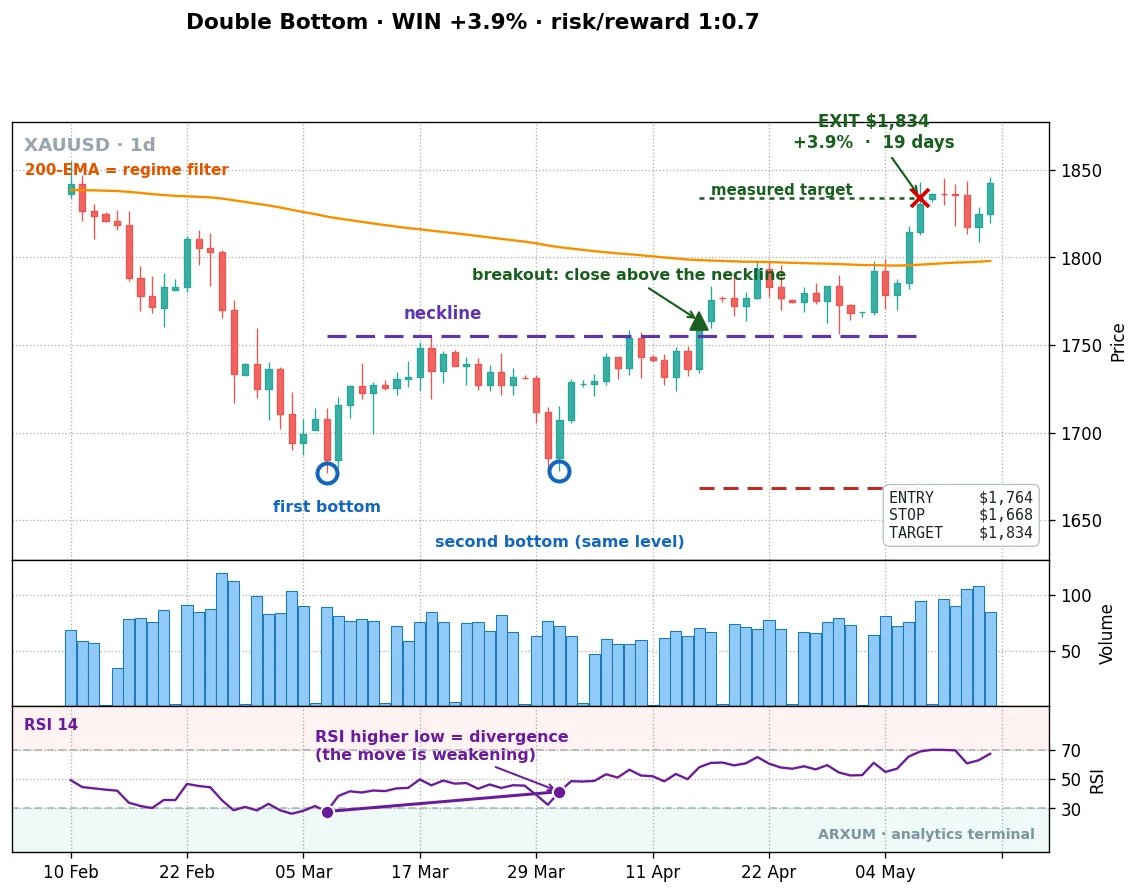
Divergence is just price and momentum disagreeing. On a double bottom, price makes a lower or equal low while the RSI gauge makes a higher low, opposite directions, which tells you the second drop had less power behind it. On the gold chart above, price held its floor while RSI climbed from 30 to 42, a clear higher low. The RSI divergence guide walks through how to spot it.
Two honest caveats keep it in proportion. First, this is the real definition. A lot of charting tutorials mislabel two rising lows as divergence, but if price and RSI are both rising, that is agreement, not divergence. Second, a clean divergence at a double top or bottom is genuinely rare, one to five times across eight years per market. When it shows up it is a strong bonus tell, not something to wait around for on every setup. The bread-and-butter confirmation is simpler, and it is next.
The confirmation that travels: a calm market
We did not assume the usual volume-and-trend stack. The engine tagged every trade with a wide menu, volume, the 200-day trend, an RSI level, RSI divergence, volatility, and more, then checked which one actually lifted the edge across markets. Most did almost nothing. One held up everywhere.
The winner was calm volatility. In plain terms, the pattern is more reliable when the market is quiet and coiled going into the breakout, not wild and whippy. A double bottom that forms during a calm stretch tends to follow through. One that forms in a panic tends to be noise.
You can read this off the chart without any new indicator: the candles get smaller and the daily range tightens before the breakout. The free tier of TradingView is enough to draw the two bottoms, mark the neckline, and add an RSI panel if you want the divergence read. Nothing here needs a paid tool.
The numbers behind the filter are the loudest part of the whole test.
| Setup | Trades | Win rate | Profit factor |
|---|---|---|---|
| Oil double top, raw | 22 | 68% | 1.21 |
| Oil double top, + calm | 9 | 89% | 4.03 |
| Oil double bottom, raw | 24 | 67% | 1.30 |
| Oil double bottom, + calm | 12 | 67% | 2.15 |
| Gold double bottom, + calm | 7 | 86% | 3.81 |
The standout is the oil double top in calm conditions: a 4.03 profit factor at an 89% win rate. The oil double bottom went from 1.30 raw to 2.15 with the same filter. And the calm rule lifted gold’s double bottom to 3.81, so it travels across markets, which is exactly what you want from a confirmation. The plain RSI-level reading everybody reaches for first did almost nothing by comparison.
You trade about half as often, but each trade is far more likely to work. That is the trade-off worth taking.
Why a small reward still makes money
This is the honest wrinkle, and it is worth getting straight, because two similar-looking numbers measure completely different things.
Reward-to-risk is a single trade. Written 1:X, the 1 is what you put at risk, entry to stop, and the X is what you stand to make, entry to target. On the oil trades above it ran around 1:0.6 to 1:0.8, so each winner made back a bit less than each loser cost. The risk-reward ratio guide covers how to read that figure on any trade.
Profit factor is the whole strategy: every dollar won divided by every dollar lost. The double bottom can have a modest reward-to-risk and still post a strong profit factor, because it wins so often. A string of small winners easily outweighs a couple of small losers.
So this is not a swing-for-the-fences pattern. The edge is the high win rate, not big winners. You enter on the confirmed breakout, already partway up from the low, so the stop sits further away than the target. You accept a modest reward in exchange for being right most of the time. It just runs on a different engine than a trend-rider. Know which one you are trading.
The proof over time, not just one trade
One good trade is an anecdote. Here is what the oil double bottom did across its full run, compounding a $1,000 account at 2% risk per trade.
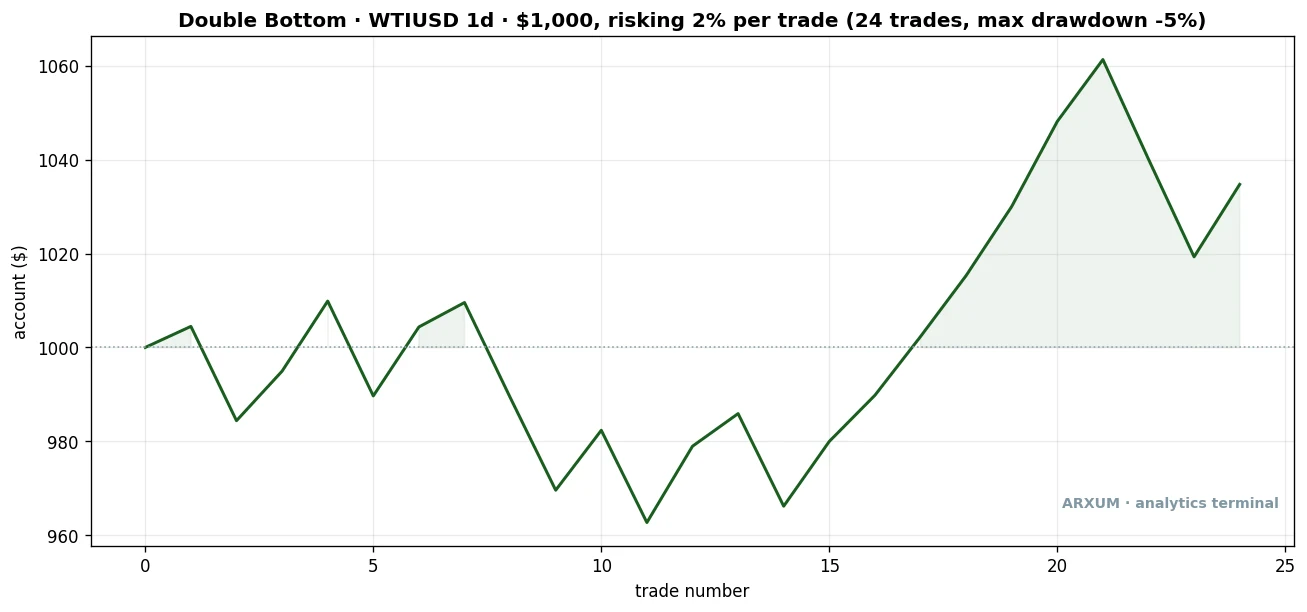
| Trades | 24 |
| Win rate | 67% |
| Reward-to-risk | 1:0.7 |
| Profit factor | 1.30 |
| Net return on $1,000 | +3.5% |
That curve is the full raw set, every double bottom, no filter, which is why it grinds rather than gallops. It chops sideways for a long stretch, then the back third carries it.
Be clear-eyed about the +3.5%. That is the raw pattern over the whole eight years on oil. The real edge sits in the calm-volatility subset from the filter table earlier, where the double bottom posts a 2.15 profit factor and the double top a 4.03, because you skip the noisy setups and keep the clean ones. The raw curve is here to show you the honest baseline before filtering, not the headline result.
This is a selective, slow pattern. The clean oil setups come a couple of times a year. The honest way to use it is as one reliable signal among several you scan for across markets, not your only source of trades.
One number worth checking: when we split the eight years in half, the oil edge survived. The method was built on the earlier years, then run on the later years it had never seen. The oil double bottom’s out-of-sample profit factor came in at 1.87, up from 0.66 on the build half, and the oil double top held at 1.32.
That matters, because the real test of a strategy is whether it still works on data nobody tuned it to. This one did, on both sides. I would not promise the jump repeats, but it is the opposite of a setup that only looks good on the exact stretch of history it was fitted to.
When a clean pattern still loses
Honesty cuts both ways, so here is a textbook-clean oil double bottom that did everything right and still lost.
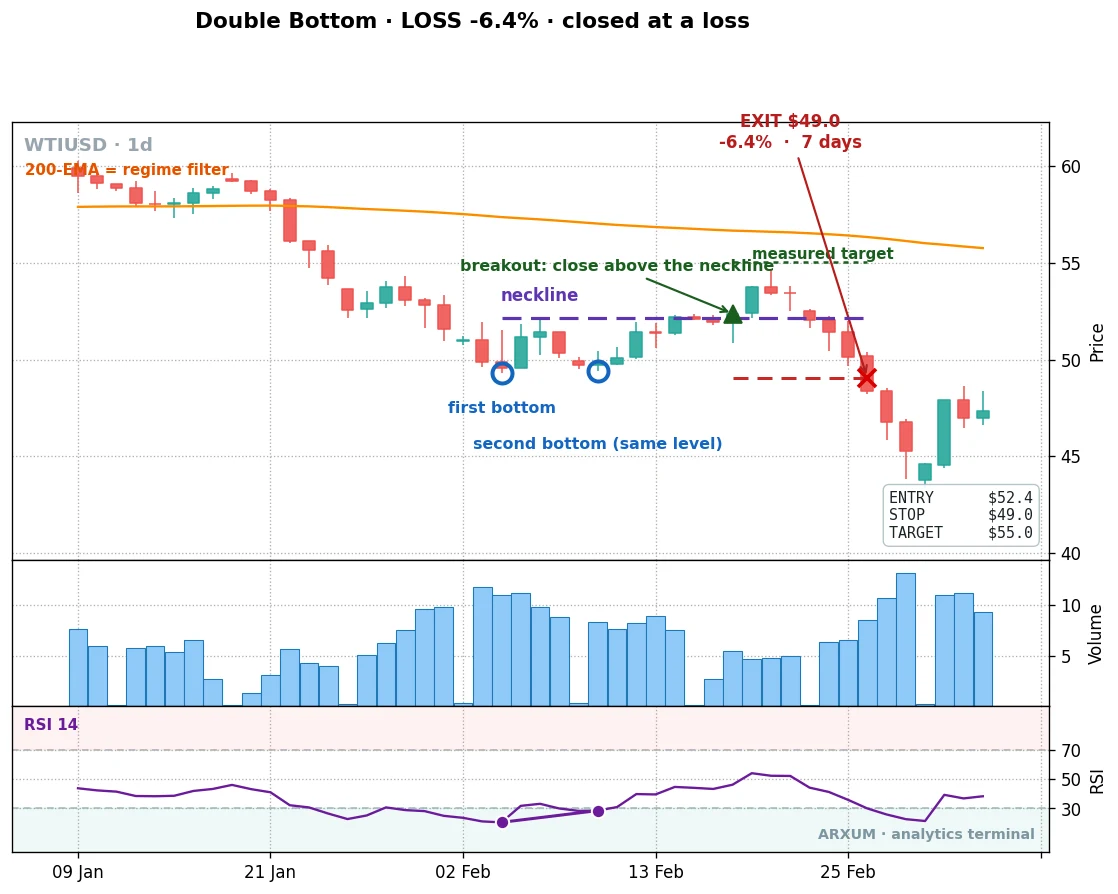
The shape was perfect. Two lows at one level after a downtrend, a clean close above the neckline, the long triggered. Then the floor fell out. A market shock hit, oil collapsed, and the trade was stopped out for a 6.4% loss over 7 days. No reversal arrived because the whole regime broke.
The lesson here is not “the pattern is unreliable.” It is that a clean pattern is never a guarantee, and the stop is what makes that survivable. The shape gave a good entry. The shock was unforecastable. The 2% risk rule and the stop below the second low capped the damage at a single small loss instead of a disaster. You can’t avoid the odd loser like this. You can make sure it stays small.
The short side, when the market reverses: a double top on oil
The double bottom is the long side. The double top is its mirror, traded short, and it pays in the same place the bottom does: a market that actually turns. Here is one on oil (WTI), a clean M that rolled over and paid.
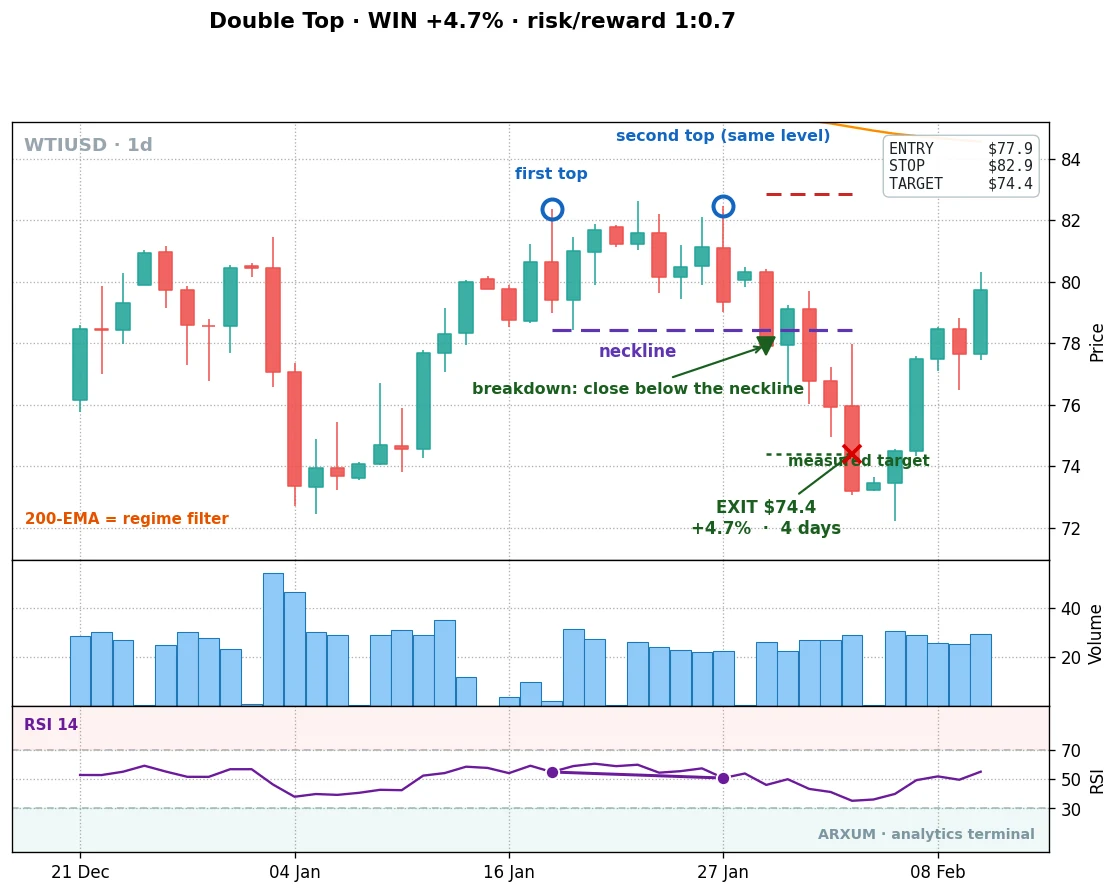
Read it as the bottom flipped upside down. Price had been climbing, then it pushed to a ceiling, pulled back, and pushed to almost exactly the same ceiling a second time. Same resistance, tested twice, the buyers unable to break through. The low of the dip in between is the neckline. When a candle closes below it, the sellers have taken control and the short is live.
- Entry: $77.9, on the close below the neckline. A short, so you sell.
- Stop: $82.9, above the second top. The gap up to the stop is your risk.
- Target: $74.4, the pattern height projected down from the neckline.
- Result: target hit 4 days later, a 4.7% gain on the short.
The takeaway: the short side is not a different skill. It is the same two-test structure, the same measured move, the same calm-market read, pointed the other way. Where a market genuinely cycles, like oil, the double top pays just as the double bottom does.
That last clause is the whole catch, and it is where gold splits off. On oil the top works because oil turns. On gold the top fails, and the next section shows why.
Does it hold beyond oil?
Oil leads, but one market proves nothing. Here is the full universe for both sides, each on the daily, so you can see where to point this pattern and where to keep it holstered.
| Market | Double bottom | Double top |
|---|---|---|
| Oil (WTI) | 1.30 | 1.21 |
| Gold (XAU/USD) | 1.53 | 0.44 |
| Silver (XAG/USD) | 0.72 | 0.48 |
| GBP/USD & EUR/USD | too few | too few |
Now the verdict, market by market.
Oil is the clear lead: the only market that paid on both sides, 1.30 and 1.21, and the only one where the calm filter pushed both into strong profit. That is the cyclical commodity doing what a reversal pattern needs.
Gold is the split personality. Buy its double bottoms, which paid 1.53 and were the single strongest out-of-sample survivor in the whole test, holding at 3.67 on data the method never saw, with the calm filter lifting them to 3.81. Never short its double tops, the 0.44 trap. One metal, two opposite verdicts, decided by the direction of the trend.
That asymmetry is the lesson. Gold spent the eight years in a powerful, one-way bull run. Buying a dip in a market that grinds higher works, which is why its bottoms pay so well. Shorting a top in that same market is leaning against a moving train, which is why its tops fail. The double top was asking the bull run to end, and it didn’t. There is a reason this piece shows the short side on oil and not on gold: a gold double top in a bull run is a messy, half-formed shape, because the market never truly reverses to draw a clean one. Forcing a chart of one would be dishonest. The 0.44 is the honest record.
The way you tell which regime you are in is the 200-day moving average. When price sits above a rising 200-day line, the market is trending up, and a double top is fighting it. If the bigger trend ever turns down, with price below a falling 200-day line, the roles flip, and the double top becomes the side to take.
Silver lost on both sides, 0.72 and 0.48, and its double bottom did not survive the out-of-sample split, dropping from 1.22 on the build half to 0.46 on the unseen half. It looks like gold but trades worse. Leave it alone for this pattern.
For a Forex or CFD trader, the honest read is plain. The pairs that reverse, like GBP/USD and EUR/USD, do give the pattern something to catch. But clean double tops and bottoms are rare on daily currency charts, only a handful across eight years per pair. That is one or two trades a year, not enough to build a method on by itself. So if you trade Forex, treat this as a scanner signal across several instruments, oil and gold included, rather than a standalone FX system. The richest hunting ground was the cyclical commodity market, oil first.
A quick honesty check on the method
Whenever a test sweeps several markets and filters, there is a fair worry: did we just fish until something looked good? Three things guard against that.
- Out-of-sample survival. The edge was built on the earlier years and confirmed on later years it never saw. Oil’s double bottom went 0.66 to 1.87, gold’s 0.81 to 3.67, the strongest survivor of the lot. A fished result usually falls apart on unseen data. These held.
- A real mechanism. Oil pays because it is genuinely cyclical. Gold’s asymmetry, bottoms yes, tops no, is explained by its one-way bull run. The reasons came first, not after the fact.
- We show the losers. The failed oil trade, the gold double top, silver across the board. A piece that only showed winners would be the warning sign.
How to size and place the trade
Numbers stay abstract until you put your own account behind them, so here is the oil double bottom worked all the way through, on a small account.
Say you have $1,000 and you risk 2% per trade, the figure the equity curve uses. That is $20 at stake on this trade.
- Entry on the breakout: $68.5 a barrel.
- Stop below the second bottom: $64.9.
- Risk per barrel: $68.5 − $64.9 = $3.6 per barrel.
- Position size: $20 ÷ $3.6 = 5.5 barrels.
Oil is sized in lots, not single barrels. A standard CFD lot on WTI is usually 1,000 barrels, far too big for this account, and most brokers offer a mini lot of 100 barrels or a micro lot of 10. Even one micro lot of 10 barrels would risk about $36 here, over 3% of a $1,000 account.
So at honest 2% risk this exact trade is slightly too big at the smallest standard size. That is the math telling you the truth, not a flaw. Two clean options, and neither is “just risk more”: trade a broker that offers fractional or smaller lots so you can hold close to your real 5.5-barrel size, or wait until the account is a little larger. Either way you keep the risk at $20. The size bends to the risk, never the other way round.
Here is the version that fits, at a broker with fractional CFD sizing where you can hold 5.5 barrels directly:
- Risk budget at 2% of $1,000: $20.
- Risk per barrel: $68.5 − $64.9 = $3.6.
- Size you click: $20 ÷ $3.6 = 5.5 barrels (a fractional position the broker allows).
- If it stops out, you lose about $20. If it hits the target, you make about 5.5 × $2.7 = $15.
That is a real, placeable trade for a $1,000 account, as long as your broker lets you size below a micro lot. Trading the right size on the right broker is the whole game here.
Once the size is set, placing it is three fields on the order ticket:
- Buy-stop order at the neckline breakout price, so you only get filled if price actually closes through.
- Stop-loss field at the level below the second bottom.
- Take-profit field at the measured target.
Set all three when you place the order, then leave it alone and let the trade resolve on its own terms.
Risk and the discipline that goes with it
This pattern wins often, and a high win rate is its own small trap. It lulls you into treating the next trade as a sure thing, and there is no such thing.
A few rules keep you on the right side of the variance, tied to this strategy’s own numbers:
- Expect losers in clusters. Even at a 70% win rate, three of every ten trades lose, and they can land back to back. That is normal, not the method breaking.
- Watch the regime, because that is what powers the edge. If you string together three to six losses in a row, more than the pattern usually gives, check whether the market is still cycling or has slipped into a one-way trend. A reversal pattern in a strong trend is the gold-double-top trap.
- The odd shock will get through. The failed oil trade broke out cleanly, then the regime collapsed under it. A stop below the second low keeps that to one small loss. Always have it in before you’re filled.
- Never short a market making new highs, or buy one making new lows, on this pattern alone. Match the reversal to a market that reverses.
- Only risk money you can afford to lose, and keep each trade small enough that a normal losing run is boring rather than frightening.
And keep a calm eye on whether live results track the test. One quiet stretch is just variance. But if the strategy runs materially worse than its record over a real run of trades, the market may have shifted from cyclical to trending, the exact condition that flips this edge off. Don’t panic on noise, don’t ignore a sustained gap. Step back and read the regime.
What works, on a matchbox
- Trade reversals where markets reverse. Oil and other cyclical markets, not a metal locked in a one-way trend.
- Lead with oil, both sides. With the calm-volatility filter the double bottom posts 2.15 and the double top 4.03, and both survived out-of-sample.
- Buy gold’s bottoms, never short its tops. Its double bottom pays 1.53 and was the strongest out-of-sample survivor at 3.67, its double top is the 0.44 trap.
- Wait for the close past the neckline. No close, no trade. And demand a quiet, coiled market going in.
- Don’t fade a strong trend. Read the 200-day line first. Real RSI divergence is a strong bonus when it appears, but rare.
Where to go from here
If you want to use this yourself, the natural next steps are the markets and tools the method leans on. How to trade oil covers the cyclical market this pattern works best on, and why it reverses the way it does. Support and resistance is how you find the levels the two tops or bottoms form at. The RSI divergence guide is the bonus filter from the gold chart. For the close cousins that add a third test or a sloping neckline, see the triple top and bottom pattern and the head and shoulders pattern.
FAQ
What are double top and double bottom chart patterns, in plain terms?
Do these patterns actually work?
Why does it work on oil but fail on a trending market like gold?
What is the best confirmation to add?
What is the win rate?
Why is the reward smaller than the risk?
What is profit factor, and how is it different from reward-to-risk?
Which markets and timeframes are best?
Can a perfect-looking pattern still lose?
How much money do I need to start?
How do I place the trade?
How many losses in a row should I expect?
What do the key terms mean?
🌍 Our recommended brokers

Quant Researcher & Systems Builder
Quantitative researcher who builds the automated systems behind Arxum strategy testing. Works in Python and Pine Script, using AI alongside classic backtesting to validate strategies on years of real data.