What the MACD indicator actually is
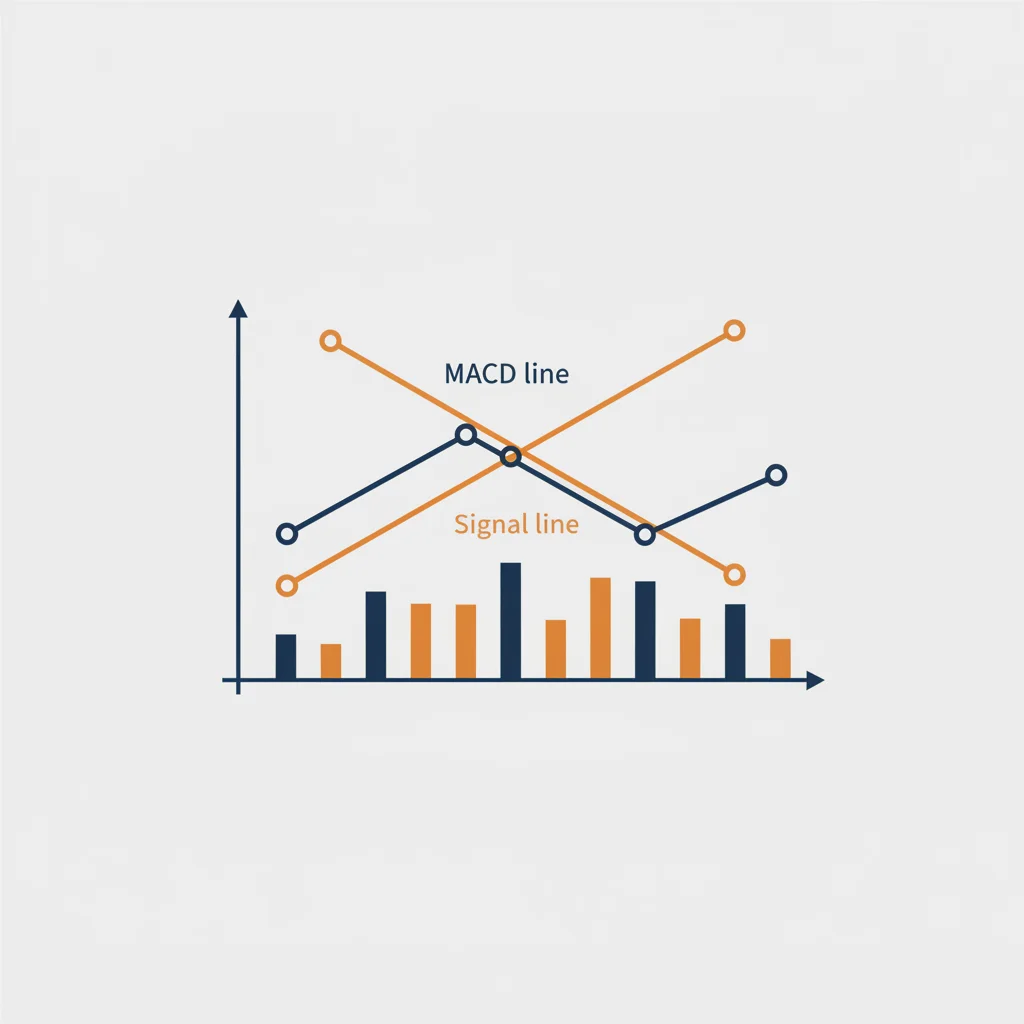
MACD stands for moving average convergence divergence, and the name describes exactly what it does. It tracks two exponential moving averages of price, a fast 12-period line and a slow 26-period line, and measures the gap between them.
When the fast line pulls away from the slow one, momentum is building. When they close back together, momentum is fading.
That gap, plotted as a line, is the MACD line. A 9-period average of it is the signal line. The bars below, the histogram, just show the distance between those two. Gerald Appel built it for daily stock charts in the late 1970s, and the 12/26/9 settings are still the default everywhere. We used those defaults, not a tuned set.
Here is what the cross looks like on a real chart of gold (XAU/USD).
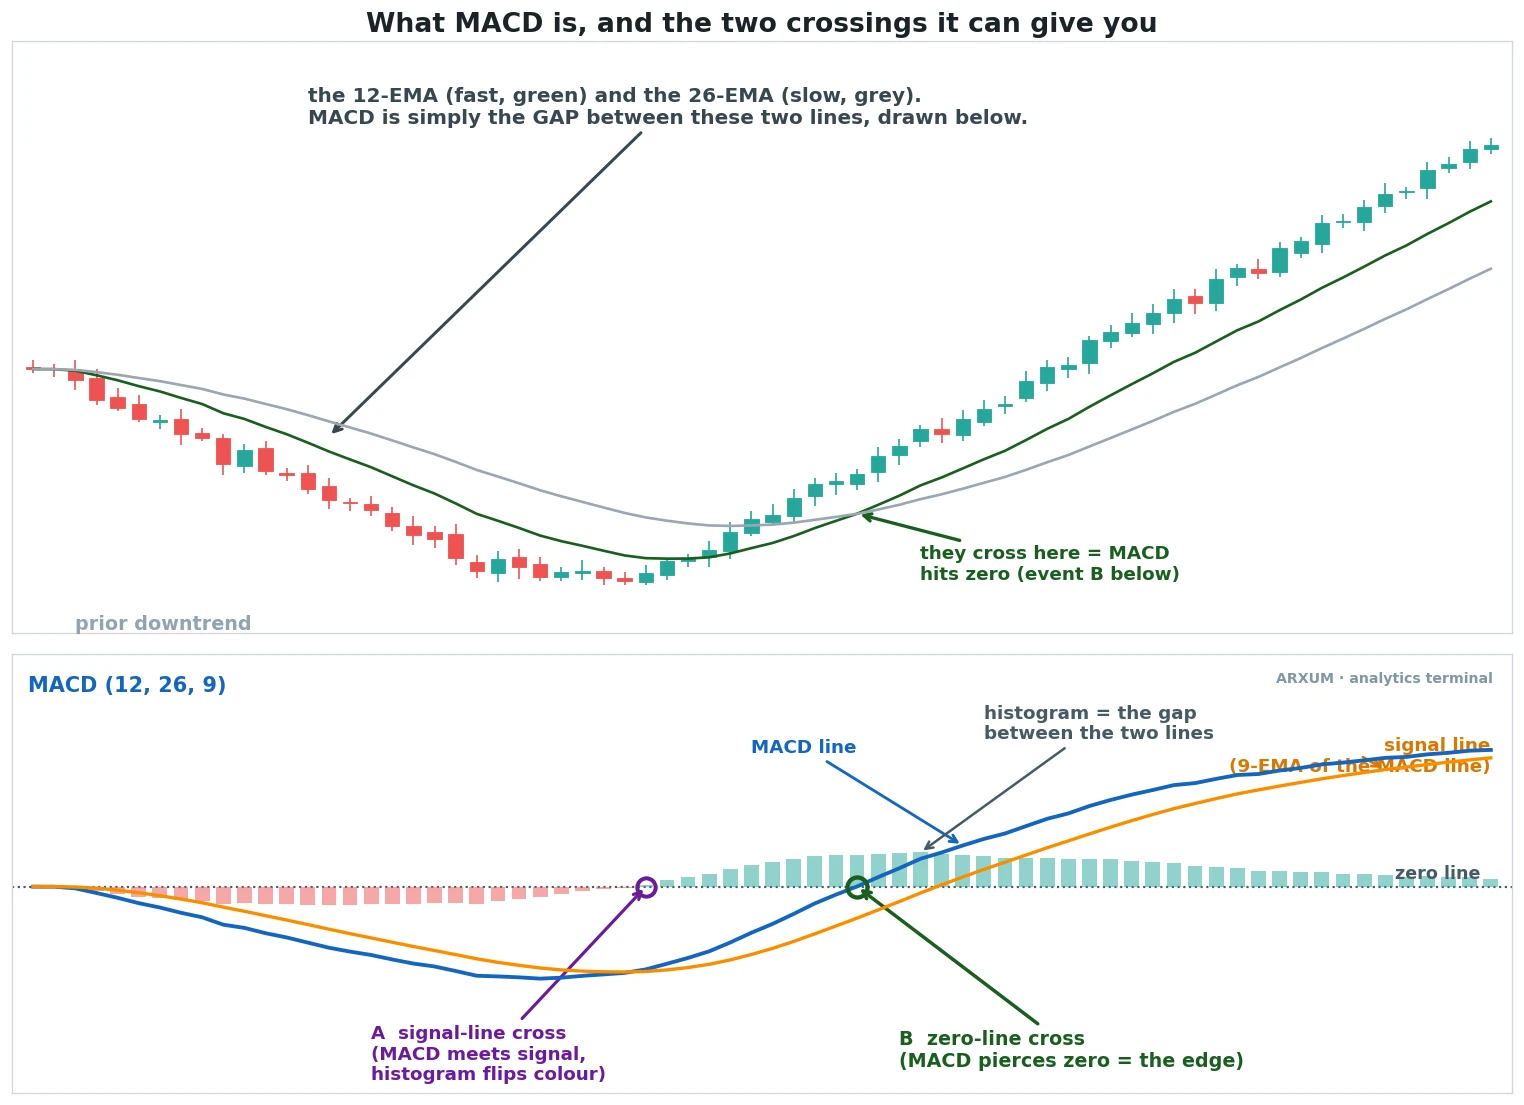
The whole indicator boils down to two questions a trader asks of it. Has the MACD line crossed its signal line? That is the signal-line cross. And has the MACD line crossed the zero level? That is the zero-line cross. They sound similar. They are not the same trade, and the difference is the whole point of this guide.
The two crosses, and why the popular one is the weaker one
Most guides to the MACD indicator teach the signal-line cross first, because it fires often and feels active. The zero-line cross is slower and stricter, so it gets a footnote. The data flips that ranking on its head.
The signal-line cross triggers when the MACD line crosses its signal line. It happens a lot, several times the rate of the other cross, which is exactly why beginners like it. More signals feel like more opportunity.
The zero-line cross triggers only when the MACD line crosses the zero level itself. That happens when the fast 12-period average overtakes the slow 26-period average outright, so momentum has turned net-positive, not just wobbled. Fewer signals, higher conviction.
We ran both as full mechanical strategies, net of real spread and fees, across four markets on the 4-hour chart over eight years. Direction was set by the 200-period EMA: long while price is above it, short while below. That EMA is the trend filter, the line that tells you which way the market is leaning. The EMA guide covers how it is built.
Here is what the zero-line cross did on the long side, market by market.
| Market | Trades | Win rate | Profit factor |
|---|---|---|---|
| Gold (XAU/USD) | 132 | 39% | 2.24 |
| Bitcoin (BTC) | 142 | 36% | 2.63 |
| Oil (WTI) | 108 | 39% | 1.49 |
| EUR/USD | 96 | 38% | 1.46 |
A quick word on the metric, so the numbers land. Profit factor is every dollar the strategy won divided by every dollar it lost. Above 1.0 it makes money.
A 2.24 means it won two dollars and twenty-four cents for each dollar it gave back. Read those four numbers against 1.0, and every one of them clears it.
Now the same comparison for the popular signal-line cross.
| Market | Trades | Profit factor | Out-of-sample |
|---|---|---|---|
| Gold (XAU/USD) | 317 | 1.44 | holds |
| Bitcoin (BTC) | 340 | 1.48 | holds |
| Oil (WTI) | 248 | 1.17 | fails (0.95) |
| EUR/USD | 218 | 1.17 | holds |
The signal-line cross trades two to three times as often and pays less on every market. On gold it makes 1.44 against the zero cross’s 2.24. On oil it actually breaks down on data it was never built on, dropping to a 0.95 profit factor, which means it loses money there.
The takeaway in one line: the slower, fewer-signals zero-line cross is the real MACD edge, and the busy signal-line cross most people are taught is the weaker trade. Fewer, better beats more, busier.
Does the edge survive on data it never saw?
A profit factor over the full eight years is nice, but it could just be a curve fitted to history. The test that matters is out-of-sample: build the read on the early years, then run it on the later years it has never touched. If the edge is real, it survives. If it was fitted noise, it falls apart.
We split the eight years and ran the zero-line cross on the unseen half.
| Market | First half 2018–2022 | Second half 2022–2026 (unseen) |
|---|---|---|
| Gold (XAU/USD) | 1.45 | 3.46 |
| Bitcoin (BTC) | 3.01 | 2.07 |
| Oil (WTI) | 1.16 | 1.99 |
| EUR/USD | 1.02 | 1.79 |
Read the second column. Every market stayed positive on data the method had never seen. Gold actually got stronger, from 1.45 to 3.46. That is the opposite of a fitted result, which usually collapses the moment it meets fresh data. An edge that holds up on years nobody tuned it to is one you can lean on.
The signal-line cross does not pass this test as cleanly. It held on three markets but went negative on oil, the 0.95 in the table above. One cross survives the unseen data everywhere. The other does not. That settles which one to trade.
A zero-line cross on gold, start to finish
Here is one of these trades on spot gold (XAU/USD), with the cross and the exit on the chart. Read it as the anatomy of the setup.
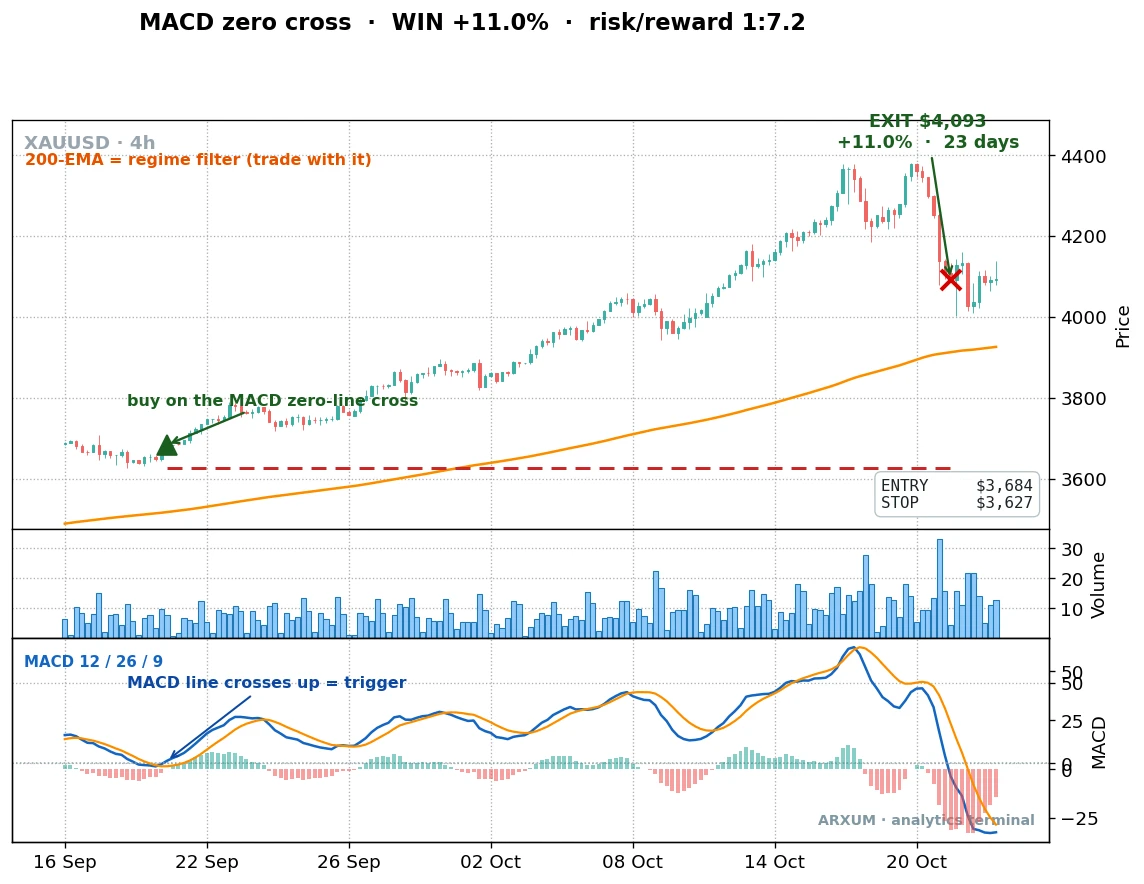
The setup is mechanical. Price was sitting above its 200-period EMA, so the trend was up and only longs were allowed. The MACD line then climbed through the zero level. That is the trigger. Momentum had turned net-positive, the fast average had overtaken the slow one, and the trade went live on the close of that candle.
- Entry: $3,684, on the close as MACD crossed zero.
- Stop: below the recent swing low, the gap to it is your risk.
- Exit: $4,093 when MACD fell back below zero, +11.04%.
- Reward-to-risk: 1:7.2.
That reward-to-risk figure, written 1:7.2, means the trade made about seven times what it had at risk. The 1 is the distance from entry down to the stop. The 7.2 is how many times that distance the trade earned. The risk-reward ratio guide walks through reading that number on any trade.
This is the zero-line cross doing what it does best. It enters late, only once momentum is clearly positive, and it holds while momentum stays positive. You give up the early part of the move in exchange for skipping the false starts the signal-line cross keeps taking.
A second gold winner, and an honest loser
One trade is an anecdote. Here is the same cross, same rules, catching another clean move on gold.
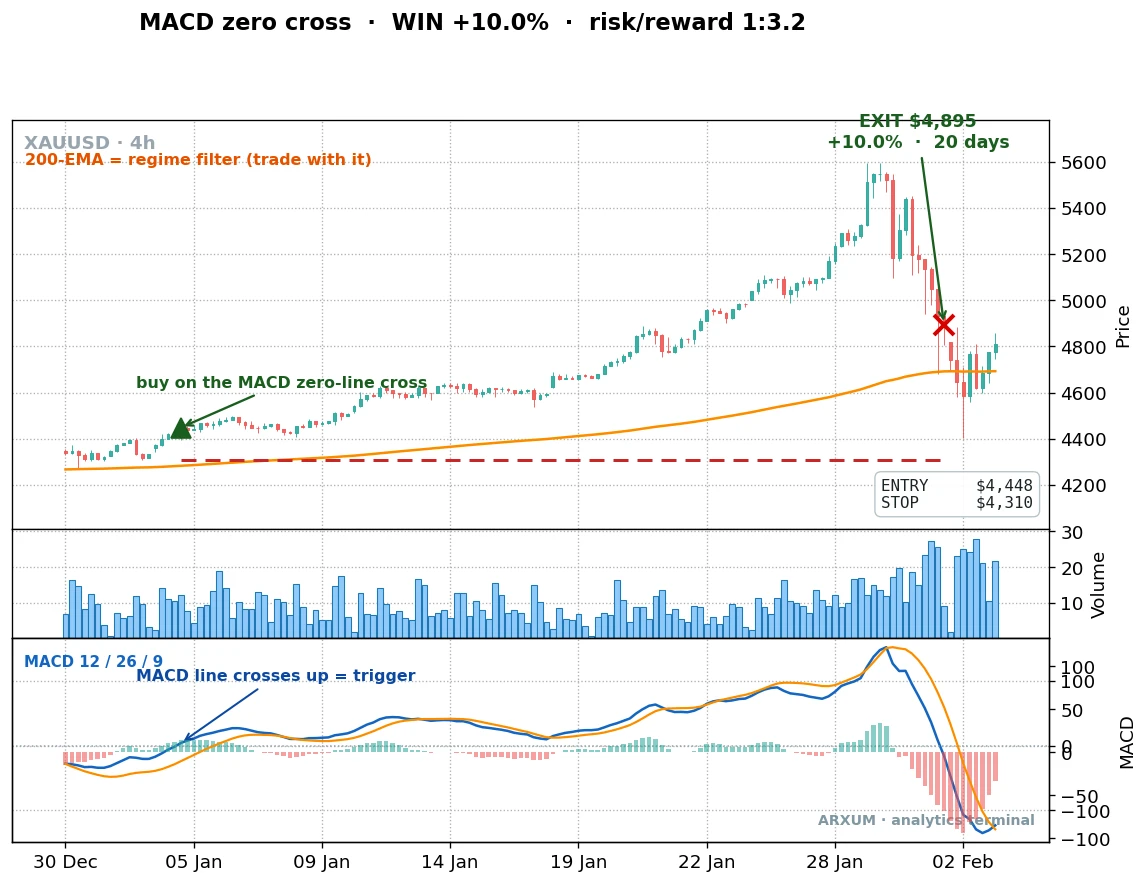
Same shape, same logic. Price above the 200-period EMA, MACD crossing up through zero, a hold while momentum ran, an exit when it rolled back under. A 10% gain at 1:3.2.
Now the honest part. The cross does not win every time, and pretending otherwise would be useless to you. Here is one that fired straight into a top and reversed.
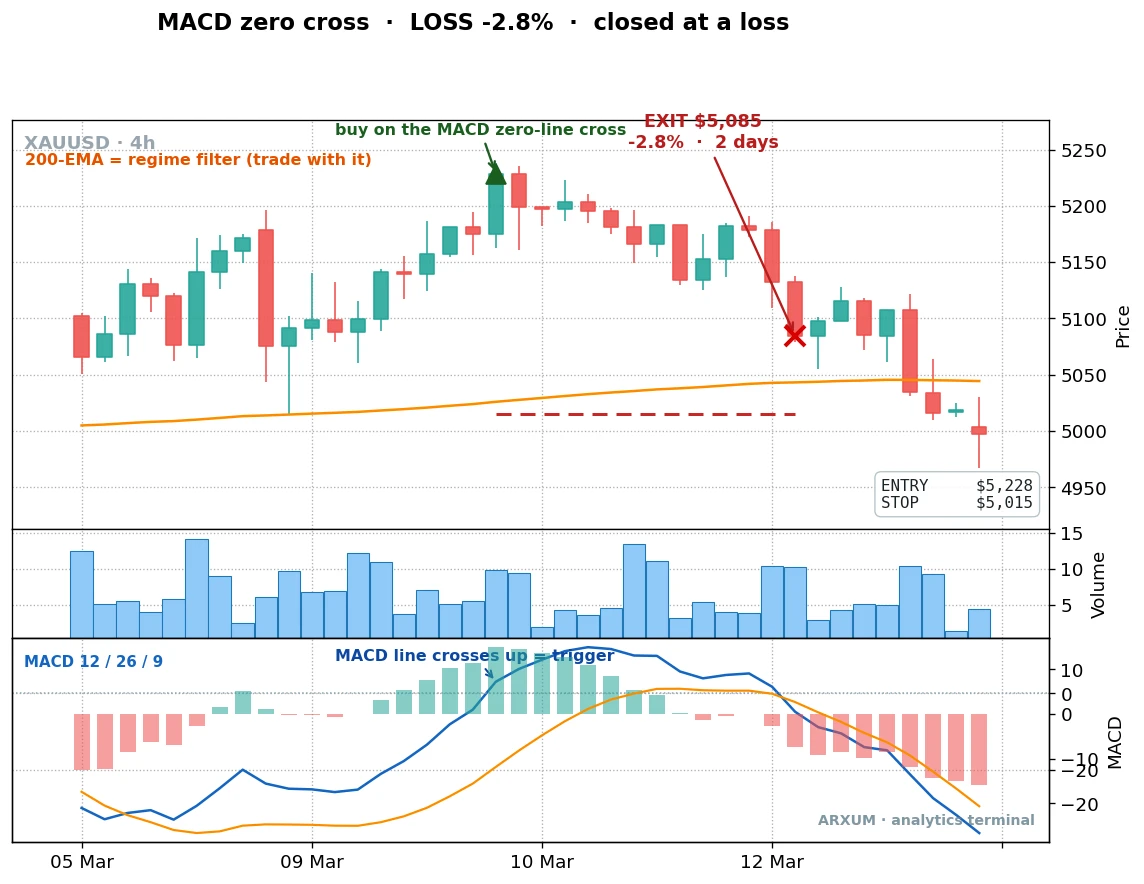
The cross was valid. Price was above the EMA, MACD pushed through zero, the trade triggered exactly by the rules. Then the move had no follow-through, price turned, and it closed for a 2.79% loss.
No mechanical signal avoids this. What it does do is keep the loss small, under 3%, while the winners ran to 10% and 11%. That asymmetry is the whole engine. A 39% win rate sounds low until you see that the winners are several times the size of the losers.
The rule of thumb here: this is not a high-accuracy strategy, it is a high-reward one. You will be wrong more often than right, and you still make money, because a winner pays for several losers. If you cannot sit through a string of small losses without flinching, this cross is not for your temperament.
The proof over time, not two trades
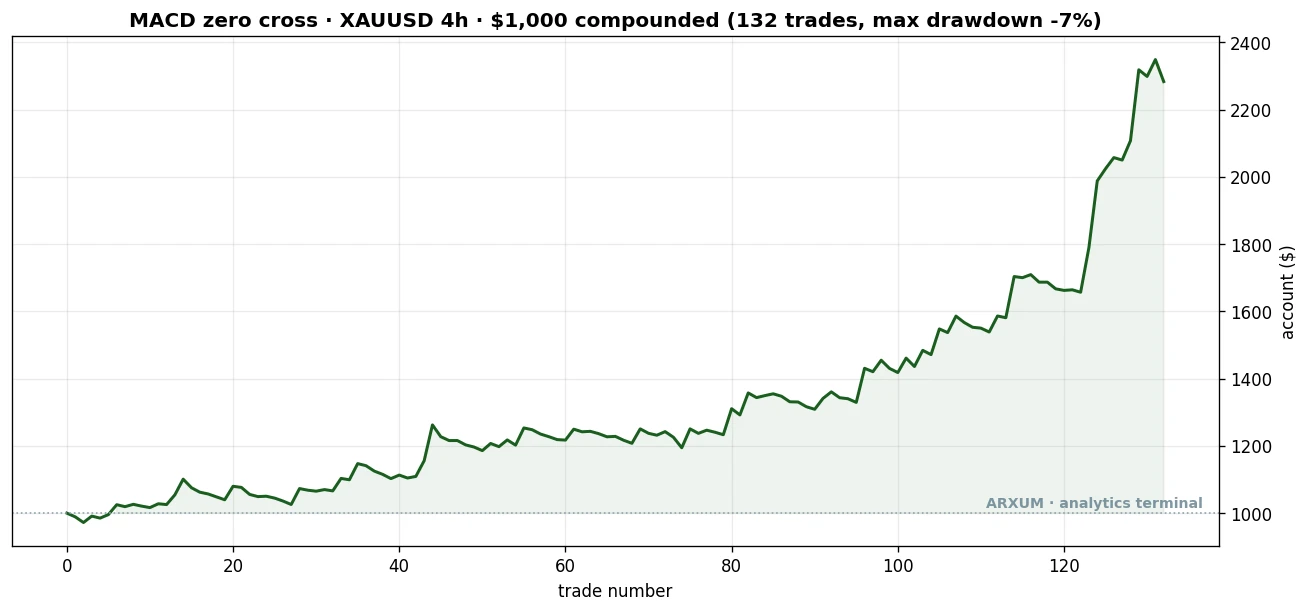
Two winning charts are an anecdote. Here is what the gold zero-line cross did across the full eight years, compounding a $1,000 account at 2% risk per trade.
| Trades | 132 |
| Win rate | 38.6% |
| Reward-to-risk | 1:3.6 |
| Profit factor | 2.24 |
| Expectancy | +0.66% / trade |
| Out-of-sample profit factor | 3.46 |
| Max drawdown | 7% |
| Net return on $1,000 | +128% |
That curve grinds rather than gallops, which is exactly right for a sub-40% win rate. Long flat stretches, then a few big winners carry it. Expectancy is the plain version of the edge: each trade, win or lose, was worth about +0.66% on average over the full set. That number is small and positive, and small-and-positive compounded over 132 trades is what built the curve.
The contrast: the faster signal cross
To see why the zero-line cross earns its keep, look at the cross it beat. Here is a signal-line cross on gold, the popular entry, doing fine on its own.
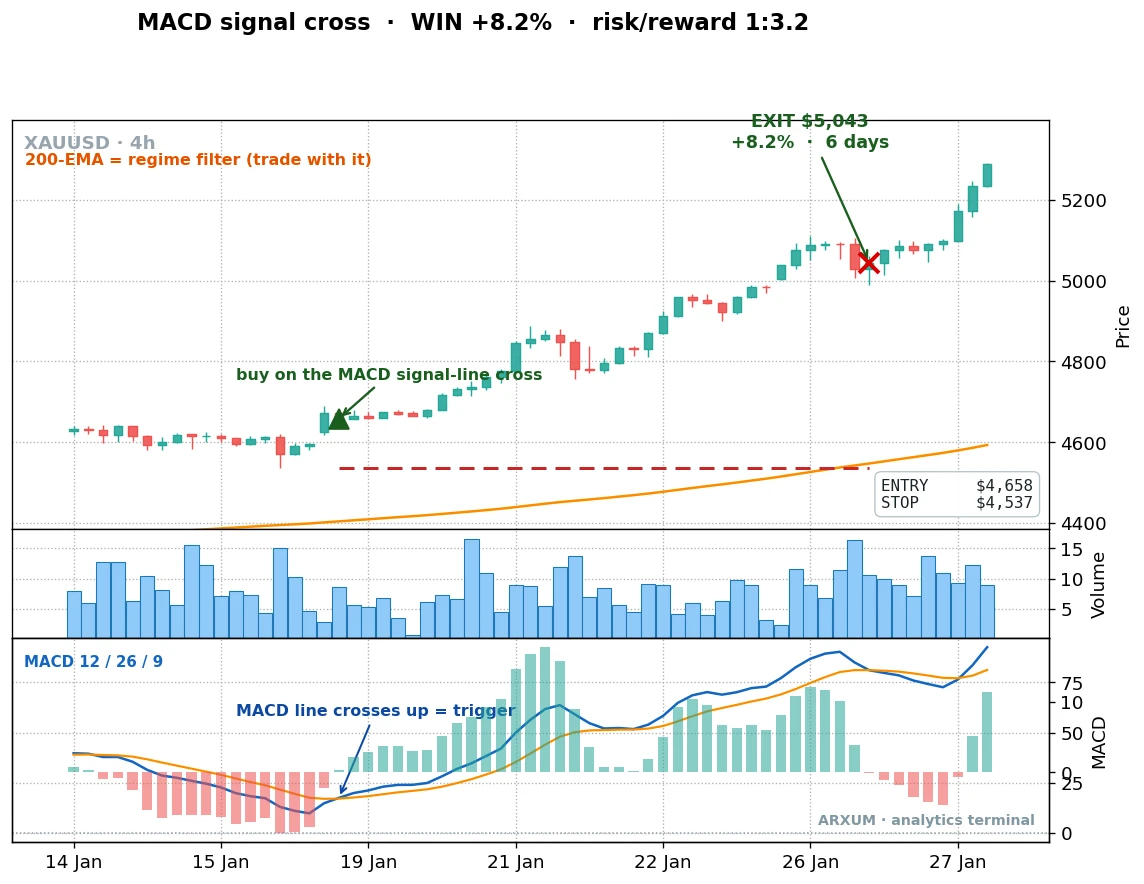
This was a good trade. The signal-line cross is not useless, it makes money on gold and Bitcoin. The catch is the ones you do not see: it fires three times as often, and most of the extra signals are noise that drags the whole profit factor down to 1.44. The faster cross gets in earlier and more often, and pays for that frequency with a pile of small chops.
So the choice is not “one works, one is broken.” Both work on trending markets. The zero-line cross simply keeps more of what it makes by trading less. Fewer signals, cleaner edge.
The confirmation that travels, and the one that does not
This is the part worth being plain about. Our own Bollinger Bands and Darvas box research both landed on the same headline: volume is the edge, a surge on the breakout separates the real moves from the fakes. It was tempting to bolt the same volume filter onto MACD and call it done.
The data said no. We tagged every MACD trade with a wide menu of confirmations, volume, a calm-or-wild volatility read, trend strength, an RSI level, and more, then checked which one actually lifted the edge across markets. Volume was not it. On gold and the euro, demanding a volume surge made the zero-line cross worse.
The filter that held up was the opposite of a surge: a calm market. In plain terms, MACD’s zero-line cross works better when the move starts from a quiet, low-volatility stretch rather than a wild, whippy one.
You can read this off the chart without a new tool, the candle ranges tighten before the cross. We measured it with average true range, the standard gauge of how much a market is moving. The ATR guide explains it.
Here is the split on one chart. It scores the zero-line cross’s profit factor under three reads, no filter, with a volume surge, and with a calm market, across all four markets.
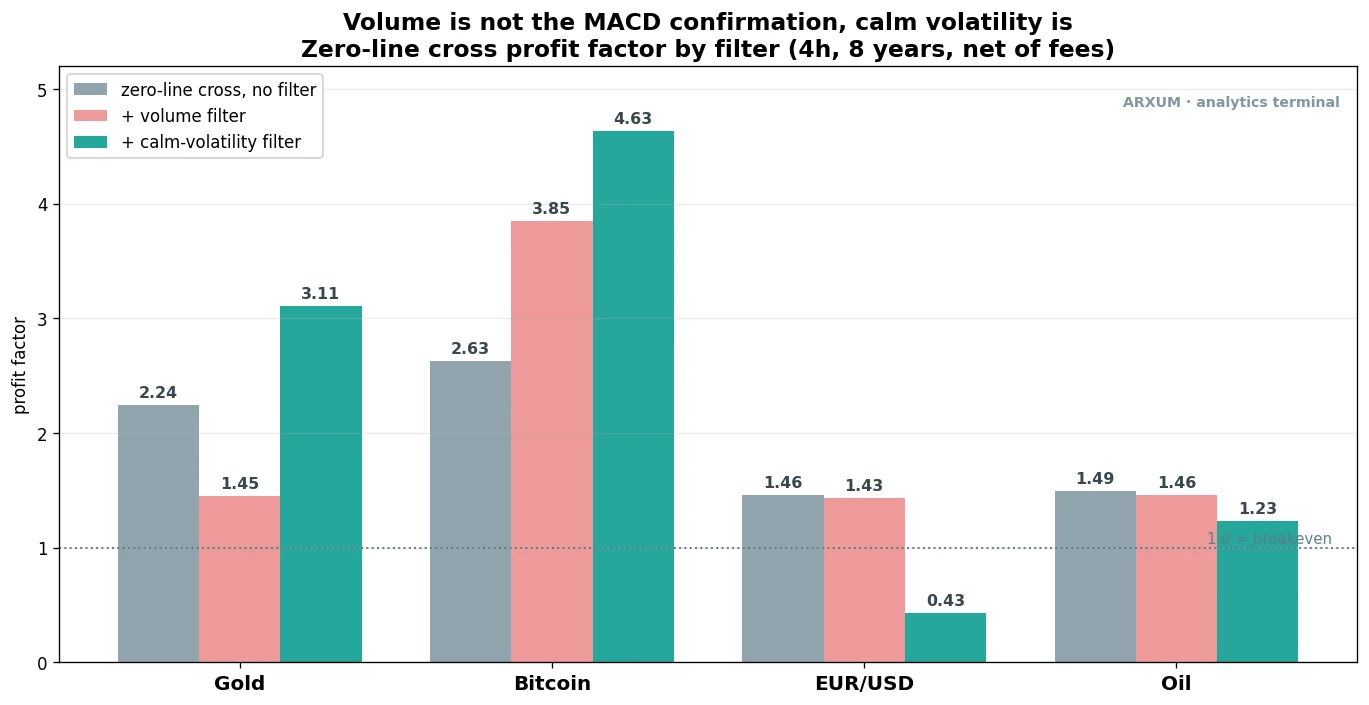
Read the gold cluster first. The volume bar sits lower than the no-filter bar, the only common filter that makes the edge worse. The calm-volatility bar is the tallest. That single picture is the whole finding. Now the same numbers in full.
| Confirmation | Gold | BTC | Oil | EUR/USD |
|---|---|---|---|---|
| Solo (no filter) | 2.24 | 2.63 | 1.49 | 1.46 |
| Volume surge | 1.45 | 3.85 | 1.46 | 1.43 |
| Calm volatility | 3.11 | 4.63 | 1.23 | 0.43 |
| Trend strength | 2.73 | 2.58 | 2.14 | 0.76 |
| Choppy, weak trend | 2.05 | 2.67 | 1.34 | 1.69 |
Read it market by market, because the lesson is in the differences.
- Calm volatility lifts gold and Bitcoin hard. Gold jumps from 2.24 to 3.11, Bitcoin from 2.63 to 4.63. On the two trending markets, the cross that starts from quiet conditions is far cleaner.
- Volume hurts gold. It drops the gold profit factor from 2.24 to 1.45. The exact filter that powers our Bollinger and Darvas setups is a drag here. That is the honest reversal, and it is the heart of this guide.
- Trend strength flips by market. Gold and oil reward a strong, directional market. The euro does the opposite, it pays better in chop. One filter does not fit all four.
- No filter is a free win. Calm volatility carries gold and Bitcoin, but it drags EUR/USD down to 0.43, below break-even. The euro keeps its edge raw or in chop, not in a quiet market. That is the point: the confirmation is a per-market choice, never a universal switch.
The real lesson is bigger than MACD: do not assume the confirmation that worked on your last indicator works on this one. Discover it per market. Volume is the edge for breakout patterns; for the MACD zero-line cross, calm volatility is, and on gold volume is an active mistake. The whole value of testing is catching this instead of guessing.
Profit factor is not reward-to-risk
Two numbers in this guide look alike and measure completely different things, so let me separate them cleanly, because a beginner blurs them constantly.
Reward-to-risk is one trade. Written 1:X, the 1 is what you put at risk from entry to stop, and the X is what you stand to make from entry to target. The gold zero-cross winner ran 1:7.2. That is a single trade’s shape.
Profit factor is the whole strategy. It is total dollars won across every trade divided by total dollars lost. The 2.24 on gold is the entire eight-year record, winners and losers netted together.
They answer different questions. Reward-to-risk tells you how a single trade is built. Profit factor tells you whether the strategy makes money over hundreds of trades. The zero-line cross has a strong profit factor partly because its individual reward-to-risk is high, the winners are big relative to the small, capped losses. Know which one you are reading.
The cross works both ways: a short on oil
Everything so far has been the long side, because the eight-year window was a powerful bull run in gold and Bitcoin, and longs carried it. But the cross is not a permanent long bias. Direction is set by the 200-period EMA, and the short side is just the mirror: short while price is below the EMA and MACD crosses down through zero.
On a runaway bull like gold, shorting is hard, the cross only pays on strong down-thrusts and needs a trend-strength filter to survive. On markets that genuinely cycle, like oil (WTI), the short side pays on its own. The clearest example is the COVID crash.
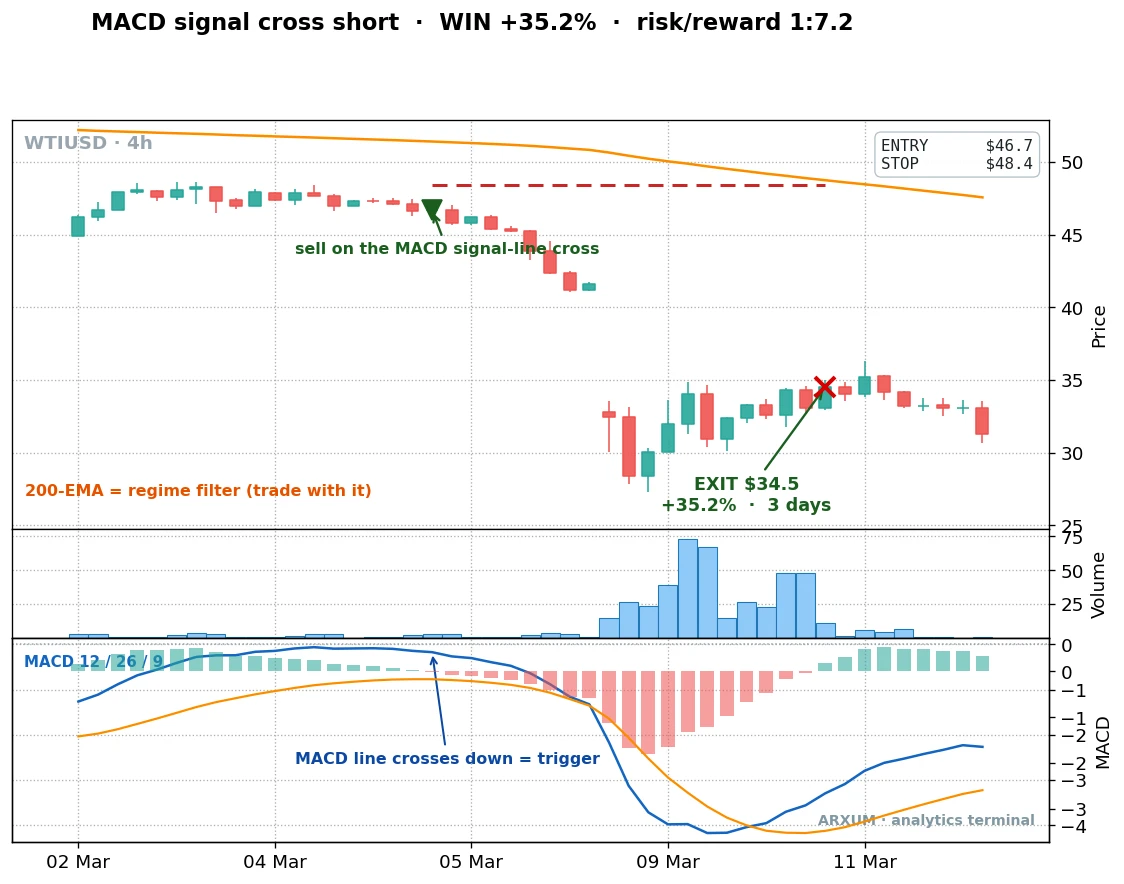
Read it the same way, upside down. Oil was below its 200-period EMA, so the trend was down and only shorts were allowed. The MACD line crossed below its signal line, momentum rolled over, and the short went live. Price fell more than $12 a barrel in three days as the market broke, a 35.16% gain on the position.
The regime rule, in one line: trade long while price is above the 200-period EMA, short while it is below, and let that line pick the side for you. The same cross, pointed whichever way the bigger trend is leaning. On the markets that cycle, both directions pay. On a one-way bull, the short side needs the trend-strength filter to be worth taking.
Where the alpha really shows: flat markets
The gold and Bitcoin numbers are impressive, but there is a fair objection: those markets went up for eight years, so maybe the cross is just riding the bull. The honest test of a strategy is whether it makes money where holding makes nothing. That is the difference between a real edge and a market that carried you.
Look at EUR/USD. Over the eight years, simply holding the euro returned about negative 2.3%, it went nowhere. The zero-line cross still made money on it.
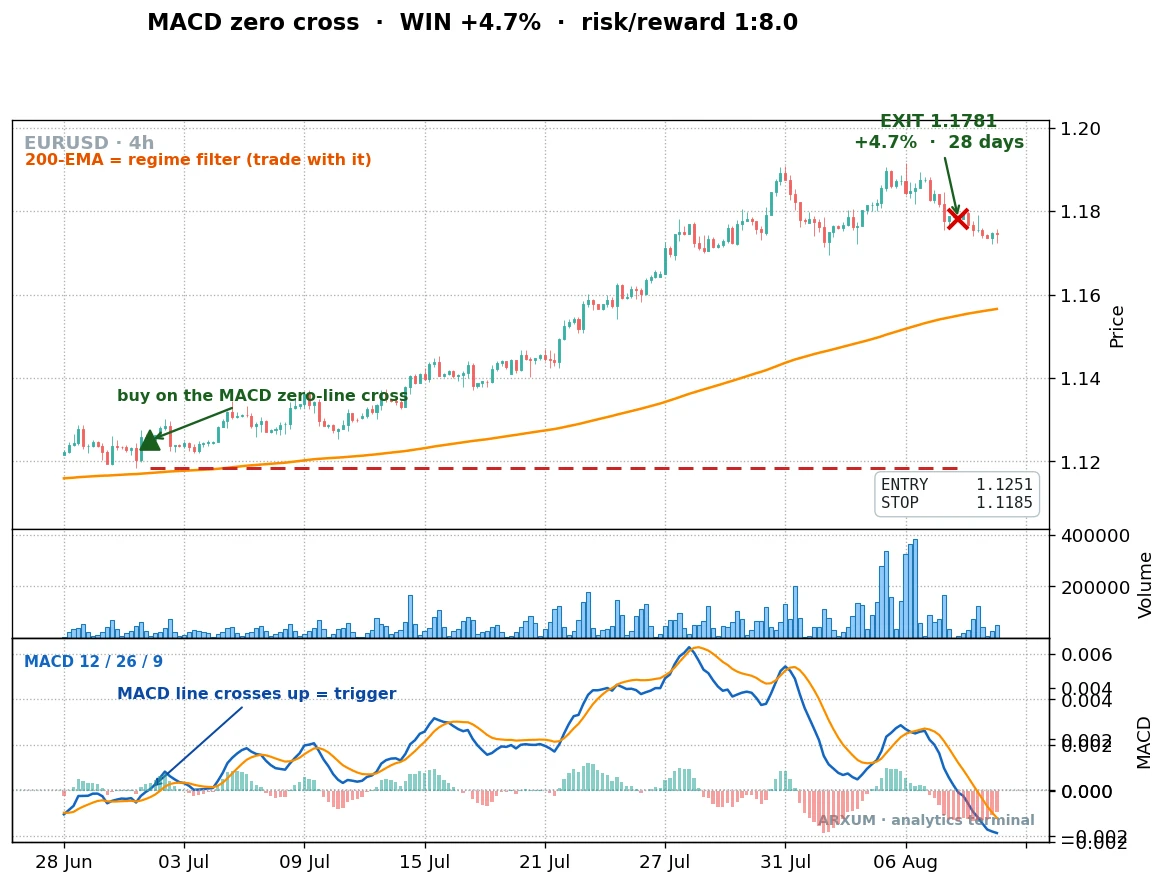
This is one of those trades, a long that ran nearly 530 pips, the small price increments a currency moves in, while the pair as a whole drifted sideways for years. Here is the full record behind that single trade, the same $1,000 account, same 2% risk.
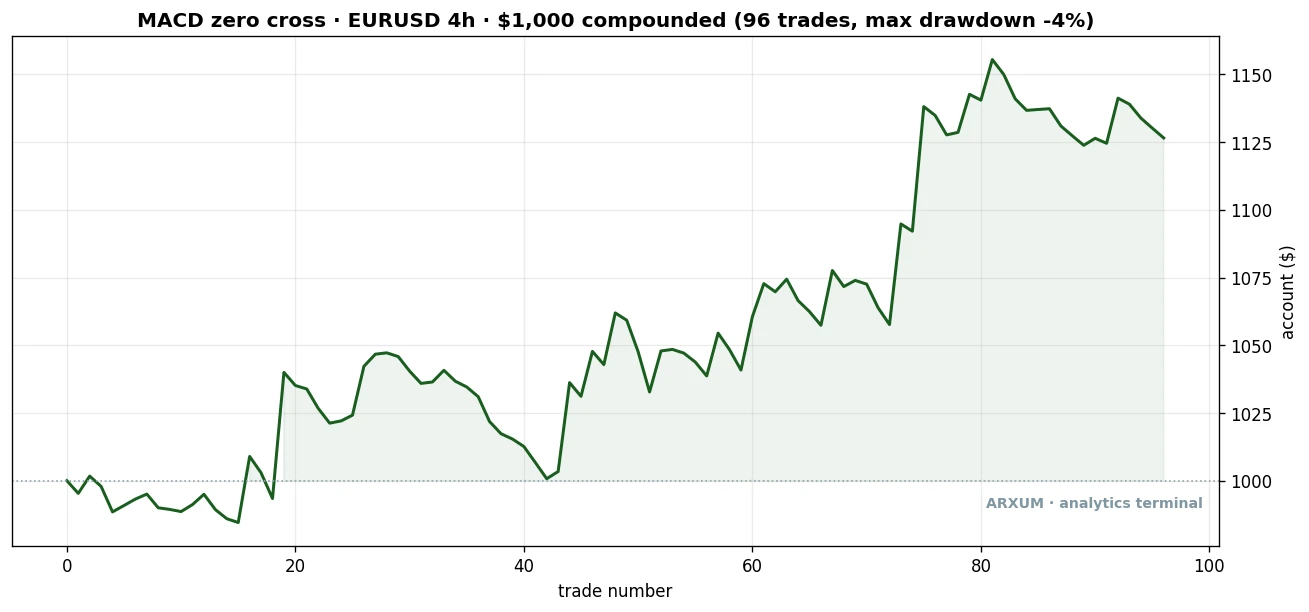
| Trades | 96 |
| Win rate | 37.5% |
| Reward-to-risk | 1:2.4 |
| Profit factor | 1.46 |
| Expectancy | +0.13% / trade |
| Out-of-sample profit factor | 1.79 |
| Max drawdown | 4% |
| Net return on $1,000 | +13% |
The numbers here are smaller than gold’s, and honestly so. A +0.13% expectancy per trade is thin.
But thin and positive on a pair that paid a buy-and-hold investor nothing over eight years, and holding up out-of-sample at 1.79, is the result that matters. The same was true on oil, where holding lost money but the cross made over 60%.
That is the proof it is real alpha, not borrowed beta. Beta is the return you get just for holding the market. Alpha is return the strategy adds on top.
You only see alpha cleanly on a flat market, because there is no underlying trend to flatter the result. On the euro and oil, where holding made nothing, the cross still worked.
For comparison, here is the same example on Bitcoin, where the bull run was enormous.
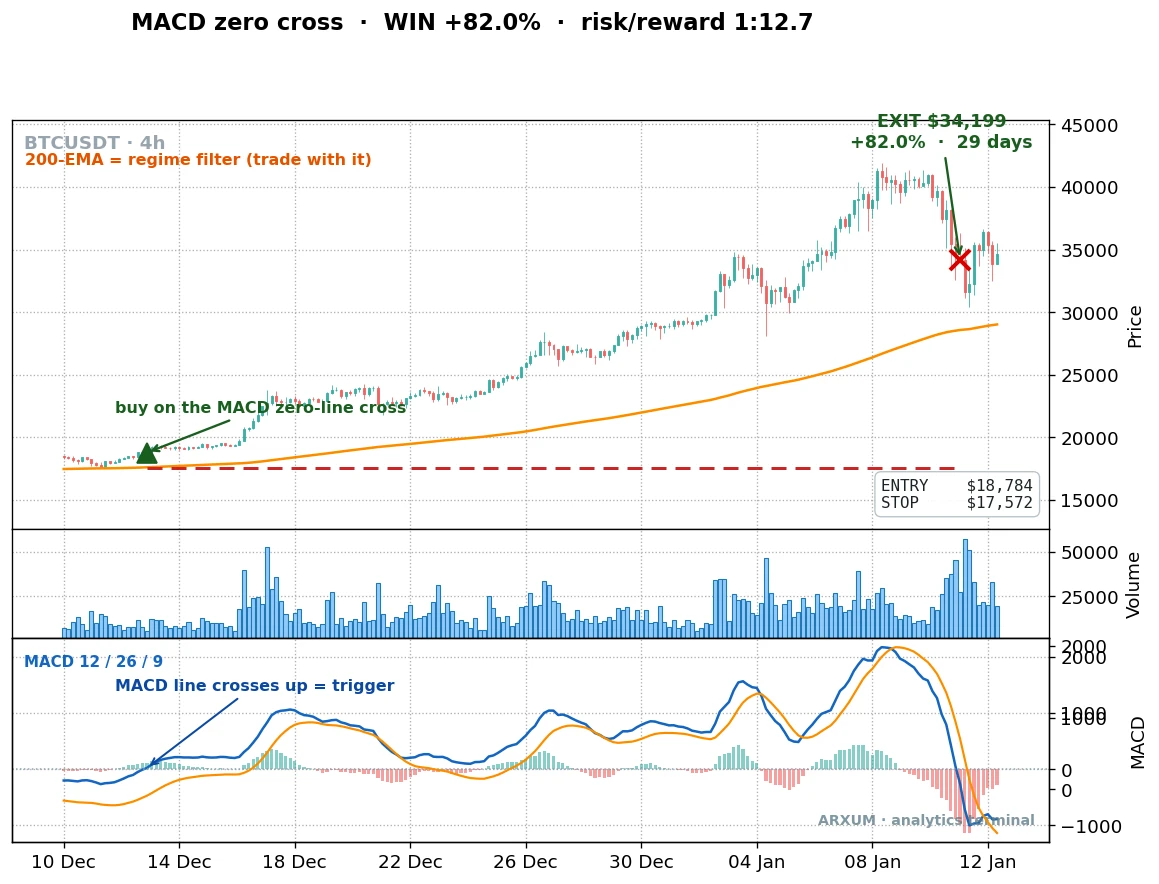
An 82% gain on one trade looks spectacular, and it was a real run in late 2020. But here is the honest context.
Over the full eight years, simply holding Bitcoin returned more than the strategy, and holding gold did too. Holding won on raw return. What it did not win on was the ride, meaning how deep your account dropped along the way.
Here is that ride, side by side. The drawdown column is the worst peak-to-trough drop you would have sat through.
| Market | Buy-and-hold drawdown | Zero-line cross drawdown |
|---|---|---|
| Bitcoin (BTC) | 77% | 43% |
| Gold (XAU/USD) | 28% | under 7% |
So if all you want is bull exposure, hold. If you want a tradeable edge that also works on flat markets and keeps the drawdown sane, trade the cross.
How to size and place the trade
Numbers stay abstract until you put your own account behind them, so here is the gold zero-line cross worked all the way through, on a small account.
Say you have $1,000 and you risk 2% per trade. That is $20 at stake on this trade.
Take the first gold example. Entry was $3,684 with the stop below the swing low. Suppose that stop sat $119 below entry, a typical distance for a 4-hour gold swing.
- Risk budget at 2% of $1,000: $20.
- Risk per ounce, entry to stop: $119.
- Position size: $20 ÷ $119 = 0.17 ounces.
Gold is quoted per ounce but sized in lots. One standard lot is 100 ounces, a mini lot is 10, a micro lot is 1. Your honest size here, 0.17 ounces, is below even a single micro lot. That is the math telling you the truth, not a flaw.
So on a $1,000 account at honest 2% risk, this exact gold trade is too big for the smallest standard lot. There are two clean options, and neither is “just risk more”:
- Use a broker with fractional or cent-lot sizing, so you can hold 0.17 ounces directly.
- Or trade a lower-priced market like oil or the euro, where the dollar stop is smaller.
Either way the risk stays $20. The size bends to the risk, never the other way round.
Once the size is set, placing it is three fields on the order ticket:
- Buy-stop at the entry level, so you only get filled when MACD has actually crossed zero on the close.
- Stop-loss field at the swing low below entry.
- Take-profit is the looser part here, since this strategy exits on the opposite cross, not a fixed target. You can set a wide target at your reward-to-risk and also plan to exit manually when MACD falls back through zero.
Set the stop when you place the order, then manage the exit on the cross. Never widen the stop to fit a bigger position.
Risk and the discipline that powers it
This strategy wins less than four times in ten, and that fact is the discipline. You have to be comfortable being wrong most of the time, because the edge lives in the size of the winners, not their frequency. A trader who needs to be right will not trade this well.
A few rules keep you on the right side of it, tied to this strategy’s own numbers:
- Expect long losing runs. At a 39% win rate, four or five losses in a row is ordinary, not a sign the method broke. The two big winners in this guide each followed several small losses you did not see. That is the shape.
- The drawdown is the price of admission. On gold the strategy’s deepest dip was under 7%, on Bitcoin 43%. Know which market you are trading and size so a normal drawdown is survivable, not frightening.
- Watch the regime, that is what powers the edge. Direction comes from the 200-period EMA. If you string together more losses than usual, check whether price is still cleanly on one side of that line or chopping across it. A cross strategy in a flat, EMA-straddling market is the worst case.
- Only risk capital you can afford to lose, and keep each trade small enough that a run of small losses is boring rather than scary.
And keep a calm eye on whether live results track the test. One quiet stretch is just variance, do not panic-quit on a bad week.
But if the cross runs materially worse than its record over a real run of trades, the market may have shifted from trending to choppy, the exact condition that dulls this edge. Don’t ignore a sustained gap, step back and read the regime.
The honest gaps
Three things to be straight about, so you size your confidence correctly.
- The settings are the defaults, not curve-fit. We used 12/26/9, the standard MACD setting every platform ships, on the same 2018 to 2026 window we tested. We did not tune the periods to the data, which is good, but the filter thresholds were chosen on that window, so some in-sample comfort remains.
- No walk-forward yet. We split the data in half for the out-of-sample check, and the edge held. We have not run a rolling walk-forward, the stricter test that re-fits the read on each new slice. The split survival is encouraging, not the final word.
- The 4-hour chart is where this lives. MACD on the 1-hour gives more signals and more noise, and we did not lean on it here. The numbers in this guide are 4-hour. Drop below that and you are in different, busier territory.
None of this sinks the result. The zero-line cross survived data it never saw, on four markets, both directions. But honest scope is part of the edge, so there it is.
What works, on a matchbox
- Trade the zero-line cross, not the signal-line cross. Slower, fewer signals, and the only one that held up on data it never saw, across every market tested.
- Let the 200-period EMA pick the side. Long above it, short below. The cross works both ways, the trend filter just aims it.
- Confirm with a calm market, not volume. Below-median volatility lifts gold to 3.11 and Bitcoin to 4.63. Volume hurts gold here, the opposite of a breakout pattern.
- It is a high-reward, low-accuracy edge. A sub-40% win rate that still pays, because the winners are several times the small losses. Cap each loss, let the winners run to the opposite cross.
- Expect it to work where holding does not. On flat EUR/USD and oil, where buy-and-hold made nothing, the cross still posted positive returns that held up out-of-sample.
Where to go from here
If you want to use this yourself, the natural next steps are the tools and markets the method leans on.
- Exponential moving average is the 200-period line that sets your direction. Worth understanding before you trade the cross.
- Average true range is the gauge behind the calm-volatility confirmation that did the heavy lifting.
- How to trade gold covers the lead market for this setup.
- How to trade oil is the cyclical market where the short side pays cleanly.
- Bollinger Bands strategy and Darvas box strategy are where volume actually is the edge, the opposite of what MACD wants. They are the contrast that makes this guide honest.
FAQ
What is the MACD indicator, in plain terms?
Does the MACD indicator actually work?
What is the difference between the signal-line cross and the zero-line cross?
What MACD settings should I use?
What is the best confirmation to add to MACD?
What timeframe is best for the MACD indicator?
What is the win rate of the MACD zero-line cross?
What is profit factor, and how is it different from reward-to-risk?
Can MACD be used to trade short, not just long?
Is the MACD edge just riding the bull market?
How much money do I need to start?
How do I place a MACD trade?
What do the key terms mean?
🌍 Our recommended brokers

Quant Researcher & Systems Builder
Quantitative researcher who builds the automated systems behind Arxum strategy testing. Works in Python and Pine Script, using AI alongside classic backtesting to validate strategies on years of real data.