
What auction market theory actually is
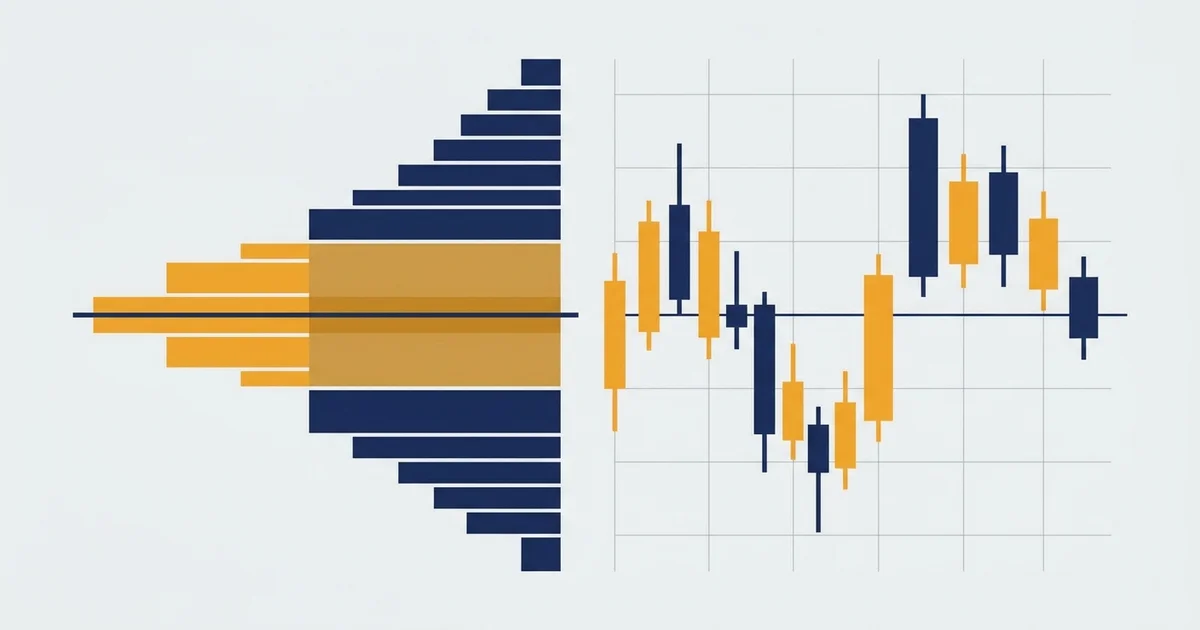
Auction market theory, sometimes called market auction theory and shortened to AMT, is a way of reading price as a negotiation rather than a line on a chart. Every trade is one side accepting the other’s price, so the market is always asking the same question: is this price fair?
Here is the whole framework on one chart before we break it into parts.
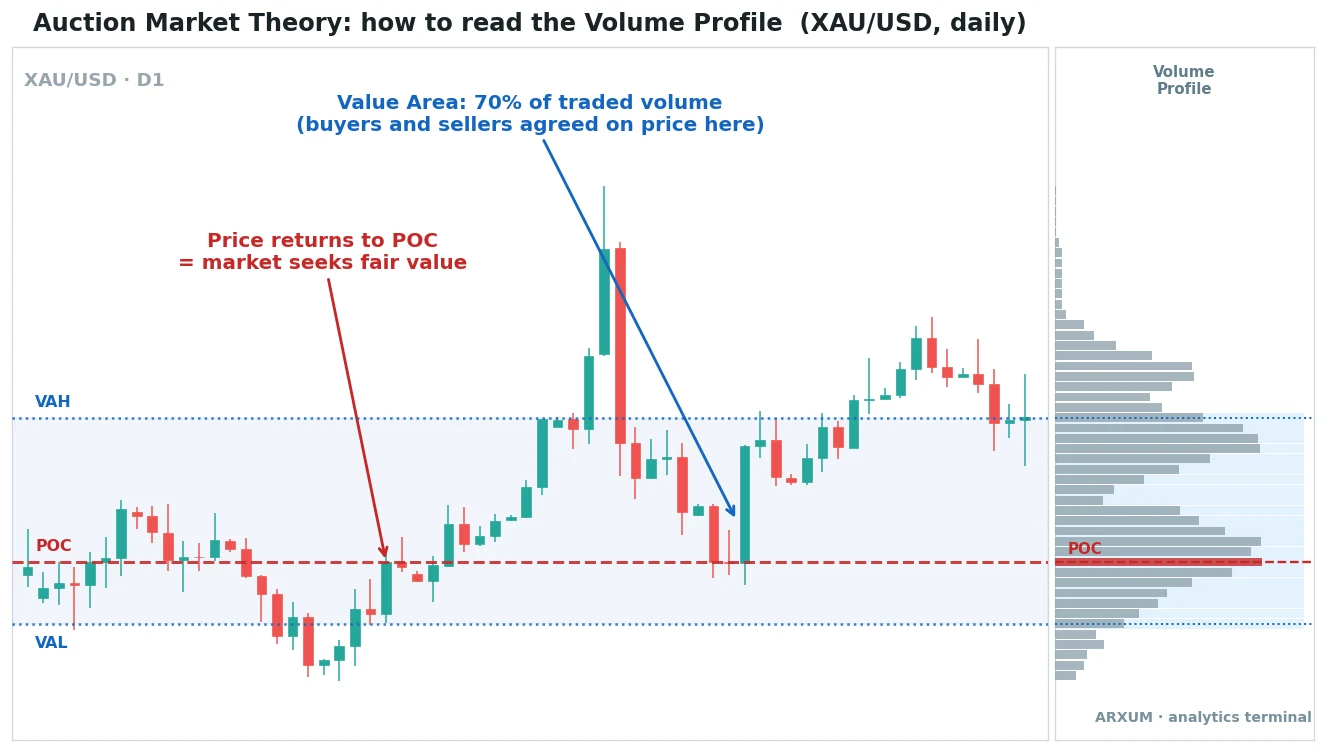
Read the picture from the right-hand histogram, not the candles:
- The volume profile is the sideways bar chart on the right. Longer bars mean more volume traded at that price.
- POC (point of control) is the longest bar, the single price where the most trading happened. It marks the market’s current idea of fair value.
- The value area is the shaded band around the POC that contains about 70% of the volume. Inside it, both sides accepted the price.
- VAH (value area high) and VAL (value area low) are the top and bottom edges of that band. They act as the auction’s fences.
The core idea is simple. Price spends most of its life inside the value area, chopping, and only breaks free when one side wins the auction and drags fair value to a new level.
The building blocks: value area, POC, and the profile
Before the setups, pin down the four terms every auction read rests on. Each one is just a fact about where volume happened.
| Term | What it is | How you read it |
| Volume profile | Volume traded at each price level | Fat = accepted, thin = rejected |
| Point of control | The single busiest price | Fair value, a magnet for price |
| Value area | Band holding about 70% of volume | Where the auction is balanced |
| VAH | Value area high, the top edge | Upper fence, often resistance |
| VAL | Value area low, the bottom edge | Lower fence, often support |
Two facts do most of the work in every auction read:
- Thin volume gets rejected fast. A price with few bars beside it means neither side wanted to trade there, so price tends to move through it quickly.
- Thick volume gets accepted. A price with long bars means the market agreed there, so price tends to stall and rotate around it.
Rule of thumb: the value area is where you expect chop and mean reversion, and the space beyond it is where you expect fast, one-way moves.
High-volume and low-volume nodes
Inside the profile, the fat and thin patches have names, and they tell you where price will stall and where it will run.
| Node | What it is | How price behaves |
| High-volume node (HVN) | A thick shelf of volume | Price slows and rotates around it |
| Low-volume node (LVN) | A thin gap in the profile | Price moves through it quickly |
| Single print | A price hit only briefly | Often revisited and filled later |
The read is short:
- HVNs act like magnets and brakes. The POC is just the biggest HVN, so any thick shelf can pause a move or become a target.
- LVNs act like slides. Price rejected these levels once, so it tends to fall or rip straight through them rather than settle. They make clean stop locations because acceptance back inside is a fast tell you were wrong.
Balance vs imbalance: the two states of the auction
AMT says a market is only ever doing one of two things. Everything else is detail.
| State | Balanced auction | Imbalanced auction |
| Price is | Inside the value area | Leaving the value area |
| Market mood | Both sides agree on value | One side has taken control |
| Looks like | Range, rotation, chop | Trend, breakout, expansion |
| Volume | Steady, average | Expanding on the break |
| What to do | Fade the edges back to POC | Trade with the breakout |
The trick is matching your tactic to the state:
- In a balanced auction, price is fair, so extremes are opportunities to fade. Sell near VAH, buy near VAL, target the POC.
- In an imbalanced auction, price has been judged unfair, so the move away from value is the trade. A close beyond VAH or VAL on rising volume is the tell.
- The dangerous move is fading a breakout that is really the start of imbalance, or chasing a trend that is really just rotation inside value.
This is the same idea behind mean reversion in a range and breakout trading in a trend. Auction theory just tells you which one the market is offering right now.
Initiative versus responsive activity
One more distinction sharpens the read. It is the difference between traders who push price and traders who lean against it.
| Activity | Who is acting | Where it shows up |
| Responsive | Buyers at VAL, sellers at VAH | Inside value, fading the edges |
| Initiative | Buyers above VAH, sellers below VAL | Beyond value, driving the break |
The practical takeaway is about who is in charge:
- Responsive activity keeps the range alive. Fresh buyers stepping in at the low and sellers at the high are defending fair value, which is the balanced auction.
- Initiative activity starts the trend. When buyers are willing to pay up beyond the value area high, or sellers to hit bids below the low, someone has decided the old fair value is wrong.
- Spotting the switch from responsive to initiative is the whole edge, since it is the moment a fade stops working and a follow begins.
Point of control trading: the fair-value magnet
The POC is the most useful single line the profile gives you. Because it marks the price with the most agreement, price keeps getting pulled back to it, which makes point of control trading a clean way to frame both entries and exits.
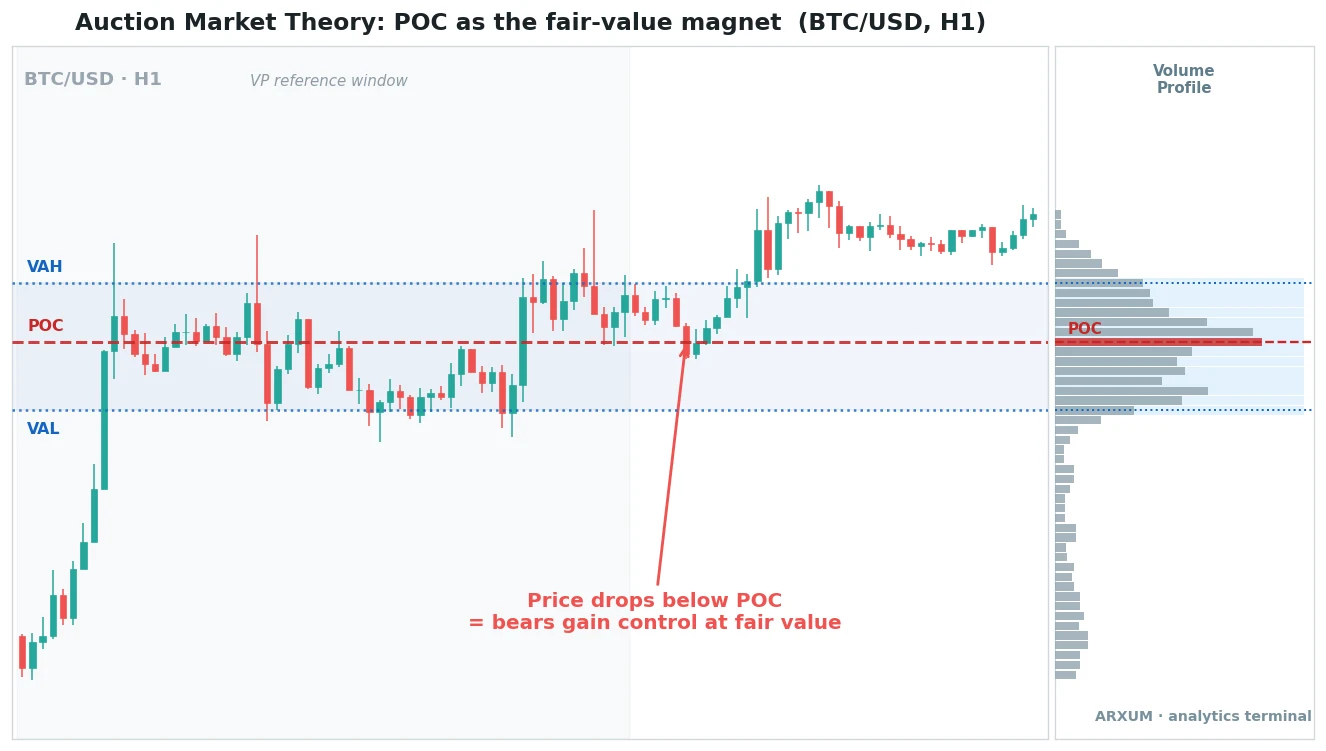
How the POC behaves, and how to use it:
- As a magnet: when price drifts away inside a range, it tends to snap back toward the POC. That return is the fade trade.
- As a pivot: price above the POC means buyers hold fair value, price below means sellers do. Losing the POC on a close, as Bitcoin does here, flips the near-term control.
- As a target: if you fade VAH or VAL, the POC is your natural first exit, since that is where the volume, and the rotation, lives.
| Role | How to use it | Best read |
| Fair-value pivot | Long above POC, short below | BTC / gold H1 to H4 |
| Fade target | Exit value-edge fades at POC | Range days, any market |
| Trend filter | Only take breaks away from a held POC | H4 to D1 |
| Session reset | Watch the new POC each session form | Forex, intraday |
Takeaway: treat the POC as the market’s current fair price. Trades toward it are mean reversion, and trades away from it, once it breaks, are trend.
Value area trading: fading the edges
If the POC is the middle, the value area edges are the fences, and value area trading is mostly about what happens when price tests them.
A test that fails sends price back to fair value. A test that holds beyond the edge starts a new auction.
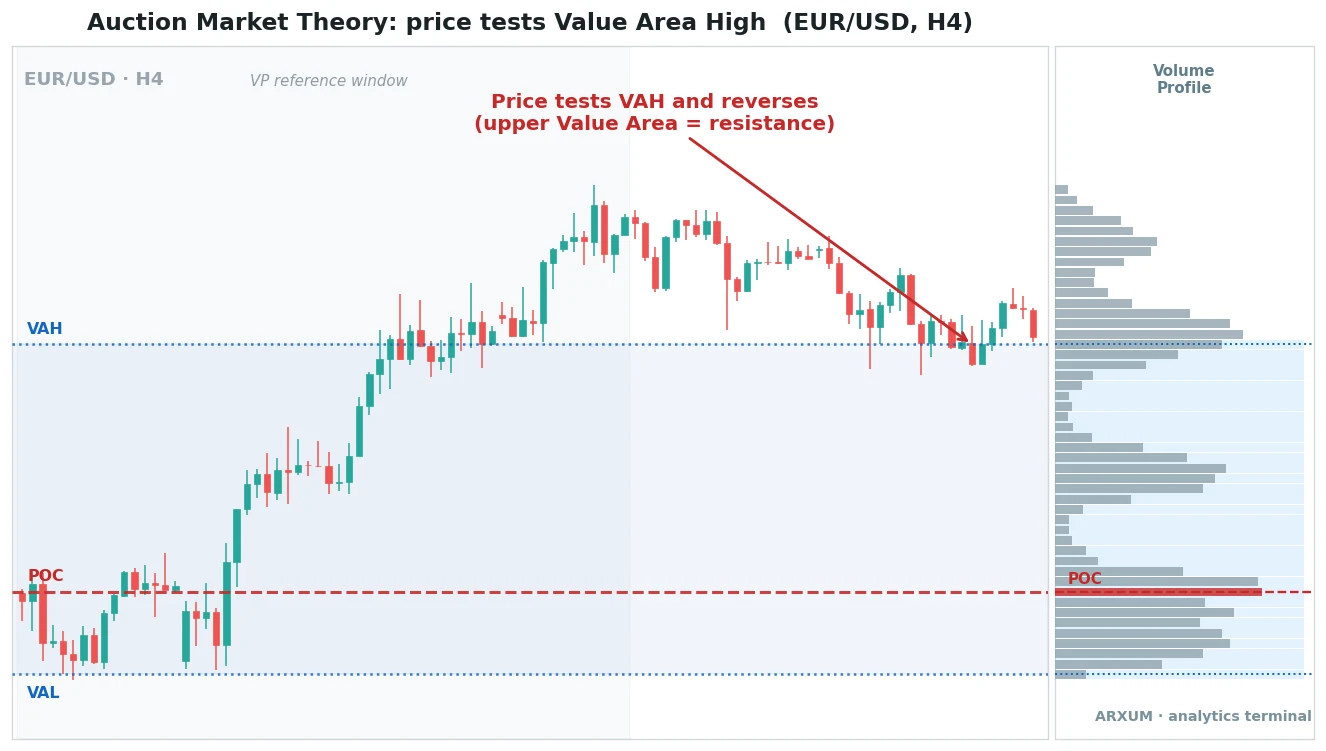
What the edges tell you:
- VAH as resistance: in a balanced market, a push to the value area high often meets sellers, as EUR/USD shows. The failed test is a short back toward the POC.
- VAL as support: the mirror image. A dip to the value area low often finds buyers, and the bounce targets the POC.
- Acceptance vs rejection: a quick wick beyond the edge that snaps back is rejection, so fade it. Several closes beyond the edge is acceptance, so the auction has moved and you follow it.
| Setup | Trigger | Target |
| Fade the VAH | Rejection wick at the high | Back to POC |
| Fade the VAL | Rejection wick at the low | Back to POC |
| Break above VAH | Closes accepted above, volume up | Next high-volume shelf |
| Break below VAL | Closes accepted below, volume up | Next high-volume shelf |
The edges pair naturally with plain support and resistance. The value area just gives you a volume-based reason for where those levels sit, rather than a line drawn by eye.
Auction market theory across markets
The auction is not a stock-market idea or a gold idea. It works on any market with a genuine two-sided order flow, which is why the same reading holds on the three charts above.
| Market | How the auction reads | Note |
| Gold (XAU/USD) | Clean value areas, deep volume | POC magnet is reliable |
| Forex majors | Session-driven value shifts | New value area most sessions |
| Bitcoin and crypto | Wider value, faster breaks | Imbalance runs further |
| Index futures | The original AMT market | Where the theory was born |
A couple of things travel with the concept, whatever you trade:
- Liquidity is the requirement. The profile only means something where enough volume trades to form a real distribution. A thin, illiquid market gives a lumpy, unreliable profile.
- The timeframe sets the auction. A daily profile describes the swing auction, an intraday profile describes the session auction. They can disagree, and that disagreement is often the setup.
Because it reads order flow rather than a fixed pattern, AMT sits close to order flow trading and liquidity concepts. The profile is just the visible footprint of that flow.
AMT vs Wyckoff, market profile, and volume profile
AMT gets mixed up with a few neighbours. They overlap, but each answers a different question.
| Framework | What it focuses on | Relation to AMT |
| Auction market theory | Fair value via a two-sided auction | The underlying idea |
| Volume profile | Volume traded at each price | The main tool that shows AMT |
| Market profile | Time spent at each price (TPO) | The original AMT display |
| Wyckoff method | Accumulation and distribution phases | Explains what happens inside balance |
The short way to hold them apart:
- Volume profile and market profile trading are the two ways to draw the auction. One counts volume at a price, the other counts time at a price. Both reveal the value area and POC.
- The Wyckoff method zooms into a balanced auction and names the stages, the accumulation before a markup and the distribution before a markdown. It fills in the story AMT sketches.
- AMT is the parent concept. The others are lenses on the same event, which is the market negotiating value.
If you want the tool-level how-to, the volume profile guide and the market profile guide cover the settings and the drawing step by step.
How to use auction market theory: a simple routine
You do not need a paid platform to start. A free volume profile on TradingView, added as the “Volume Profile Visible Range” or “Fixed Range Volume Profile” indicator, draws the value area, VAH, VAL and POC for you.
A repeatable read, top to bottom:
- Draw the profile over the recent swing or the session you care about. Note the POC, VAH and VAL.
- Name the state. Price inside the value area is balanced, so you fade. Price accepted beyond an edge is imbalanced, so you follow.
- Locate price versus the POC. Above it, buyers hold fair value. Below it, sellers do.
- Wait for the edge event. A rejection wick at VAH or VAL is a fade signal. An accepted close beyond it, on rising volume, is a breakout signal.
- Set the target off the profile. Fades aim at the POC. Breakouts aim at the next thick volume shelf, where the old auction paused.
- Size it against the level. Put the stop past the edge you faded or the level you broke, and check the reward against the risk before you click.
Two habits keep the routine honest:
- Match the timeframe to your trade. A day trader reads the session profile, a swing trader reads the multi-week profile. Do not fade a daily value edge on a 5-minute impulse.
- Let volume confirm the break. An edge break on flat or falling volume is often a trap that gets pulled back inside value. Expanding volume is the auction actually moving.
What actually works with auction market theory
The short version to remember:
- Value is a zone, not a line. The value area holds about 70% of volume, and price spends most of its time rotating inside it.
- The POC is a magnet. Inside a balance, fade the edges and target the point of control.
- Acceptance beyond value is the trend signal. A rejection wick fades, but several accepted closes beyond VAH or VAL, on rising volume, is the auction moving to a new fair value.
The risk, kept honest
AMT is a map of where trades happen, not a promise of what comes next:
- It tells you where the odds sit, not the exact moment. A value edge can hold on the third test after failing the first two.
- Balance can flip to imbalance without warning. The fade that worked all week gets run over the day the auction finally breaks, so the stop past the edge is not optional.
- A profile is only as good as its window. Build it over the wrong slice of history and the value area describes an auction that is already over.
- The profile is a read on positioning, so pair it with price action and volume rather than trading a level in isolation.
Key terms
- Auction market theory: the idea that price is a continuous two-sided auction searching for fair value.
- Volume profile: a histogram of how much volume traded at each price level.
- Value area: the price band that holds about 70% of the volume, where the auction is balanced.
- Point of control (POC): the single price with the most traded volume, the market’s fair-value magnet.
- VAH and VAL: the value area high and low, the upper and lower edges of the value band.
- Balance and imbalance: the two auction states, rotation inside value versus a trend leaving it.
FAQ
What is auction market theory, in plain terms?
It is the idea that a market is a nonstop auction between buyers and sellers looking for a fair price. Price moves up to find sellers and down to find buyers, then settles where both sides agree. That agreement zone is the value area, and the busiest single price in it is the point of control.
How do you use auction market theory in trading?
First decide if the market is balanced or imbalanced. If price is inside the value area, fade the edges back toward the point of control. If price is accepted beyond the value area high or low on rising volume, follow the breakout instead. The value area and POC give you the levels, and the state tells you whether to fade or follow.
What is the value area?
The value area is the price band that contains about 70% of the volume traded over your chosen window. Inside it, both sides accepted the price, so the market tends to rotate and chop. Its top edge is the value area high (VAH) and its bottom edge is the value area low (VAL), which often act as resistance and support.
What is the point of control (POC)?
The point of control is the single price where the most volume traded, so it marks where the market found the most agreement. It behaves like a magnet: when price drifts away inside a range, it tends to get pulled back to the POC. Traders use it as a fair-value pivot and as a natural target for fade trades.
Does auction market theory actually work?
It is a framework for reading structure, not a mechanical buy or sell signal, so it works as well as your discipline in applying it. Its strength is telling you whether to expect chop or a trend, and where the meaningful levels sit. It works best when you confirm the value edges with price action and volume rather than trading a line blindly.
Which markets and timeframes suit it best?
Any liquid, two-sided market works, including gold, forex majors, Bitcoin and index futures, since all of them build a real volume distribution. It scales across timeframes too: a daily profile reads the swing auction, and an intraday profile reads the session auction. Thin, illiquid markets give unreliable profiles, so stick to liquid instruments.
What is the difference between auction market theory and the Wyckoff method?
Auction market theory is the broad idea that price seeks fair value through a two-sided auction. The Wyckoff method zooms into the balanced phase and names the stages, the accumulation before a rally and the distribution before a decline. They are complementary: AMT gives the map, Wyckoff describes what happens inside the range.
Is auction market theory the same as volume profile or market profile?
No, but they are closely linked. Auction market theory is the concept, while volume profile and market profile are the tools that display it. Volume profile counts volume traded at each price, and market profile (TPO) counts time spent at each price. Both reveal the same value area and point of control.
How do I add the volume profile to my chart?
On TradingView, open the indicator search and add "Volume Profile Visible Range" or "Fixed Range Volume Profile," both available on free plans. It draws the value area, VAH, VAL and POC automatically over your selected range. On MT4 or MT5 you may need a community market-profile script, since it is not a default indicator.
Real-time trade setups with entry, stop loss and take profit. Daily market analysis. No subscription, no complicated theory.
🌍 Our recommended brokers


Reader Reviews
Be the first to review this — tell other traders what actually helped, or where it fell short.
Leave a Review

Forex Analyst & Senior Trader
Former FX desk trader with 8 years in institutional forex. Works in multi-timeframe analysis and order flow, turning desk experience into systematic, testable rules across forex and metals.