Why traders still rely on MACD
I started using the MACD indicator in 2020 on Binance spot. Treated every crossover as a confirmed entry. Blew a $300 account partly because of it.
The indicator itself is sound. MACD is one of the more reliable tools for confirming momentum shifts and identifying trend changes. The problem is how most traders apply it: wrong timeframe, no market context, every crossover treated as an entry signal.
This guide covers what MACD actually measures, how each component works, and what two full market cycles of testing it on crypto and forex taught me about when it’s useful and when it isn’t.
What is the MACD indicator?
MACD stands for Moving Average Convergence Divergence. Gerald Appel developed it in the late 1970s for equity markets, and it remains one of the most widely used momentum indicators in technical analysis today.
The core idea: track the relationship between two exponential moving averages (EMAs). When the faster EMA pulls away from the slower one, momentum is building. When they converge, momentum is fading.
Default settings on most platforms:
- Fast EMA: 12 periods
- Slow EMA: 26 periods
- Signal line: 9-period EMA of the MACD line
These settings were calibrated for daily equity charts. They hold up well on 4H and daily crypto and forex charts. On shorter timeframes, the signal quality drops significantly, something I had to test firsthand before believing it.
The three MACD components
MACD line: the raw difference between the 12 EMA and 26 EMA. Above zero means the short-term average is above the long-term average, meaning recent momentum is positive. Below zero means the opposite.
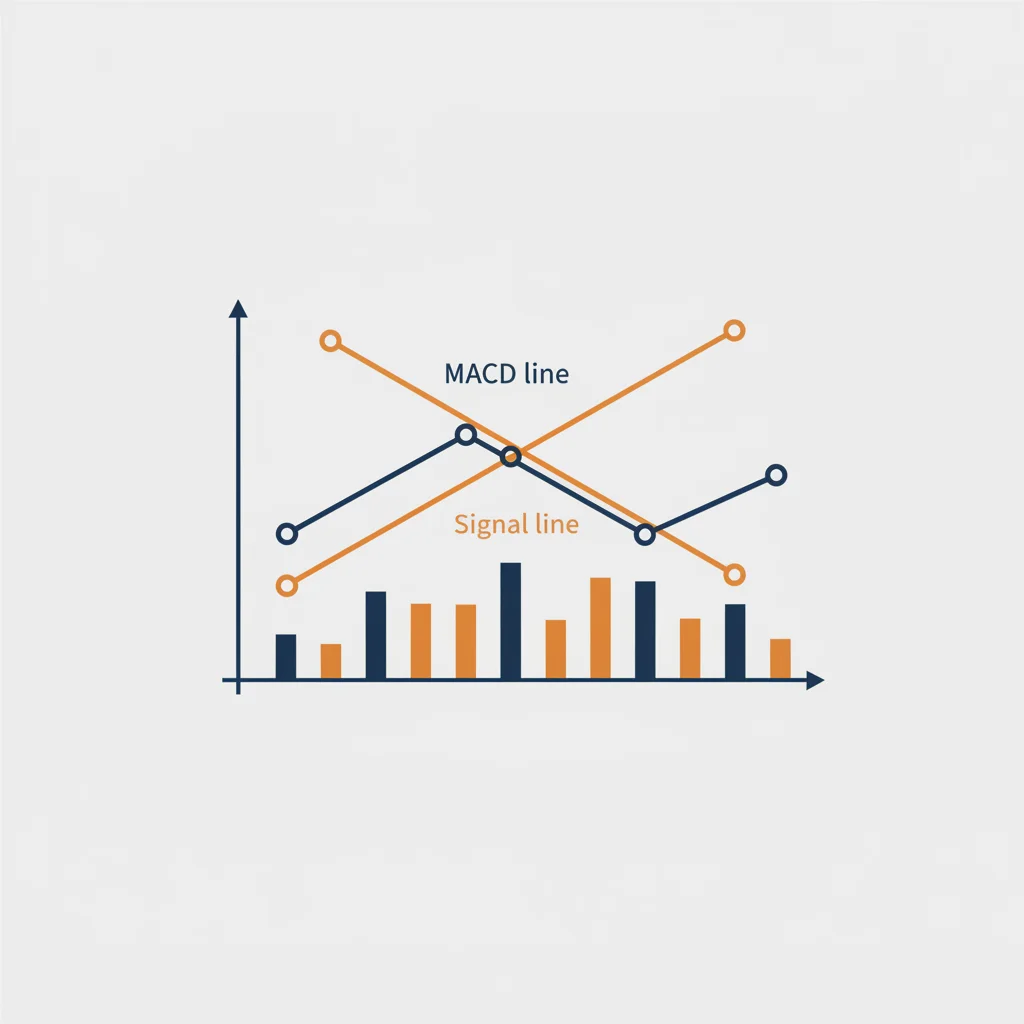
Signal line: a 9-period EMA of the MACD line itself. A smoothed version of MACD. When the MACD line crosses above the signal line, that’s a bullish crossover. When it drops below, bearish.
Histogram: the difference between the MACD line and signal line. Rising bars above zero show accelerating upward momentum. Shrinking bars warn that a crossover is coming before the lines actually touch.
Watching the histogram narrow is often more actionable than waiting for a crossover. By the time the lines cross, a portion of the move has already played out. The histogram gives you an early read on what’s about to happen.
Reading the three main MACD signals
Crossover signals
A bullish crossover: the MACD line crosses above the signal line. Bearish: the reverse.
Crossovers carry more weight when they happen at a distance from zero. A bullish crossover starting from deep negative territory says the prior downtrend had real momentum — the reversal has room to run. A crossover right at the zero line is a weaker signal with less follow-through.
I tested MACD crossovers on ETH/USDT for three months on a $600 Exness account. In trending conditions, the signal held up. In ranging conditions, price whipsawed constantly around the signal line, generating crossover after crossover with no follow-through. After that three-month test, I stopped acting on raw crossovers without a trend filter.
The crossover works when there’s a clear trend. In sideways markets, it produces noise.
Zero-line crosses
When the MACD line itself crosses from below zero to above, both EMAs have changed direction. The short-term average is now above the long-term average. This is a slower, cleaner confirmation than a line crossover.
Zero-line crosses work best as trend confirmation, not as entry triggers. If MACD just crossed above zero on the 4H chart, look for long setups on the 1H. It’s a bias filter, not a precise entry signal.
MACD divergence
Divergence is when price makes a new high but MACD doesn’t (bearish), or price makes a new low but MACD doesn’t follow (bullish). That gap between price and momentum is the signal.
Bearish divergence: price higher high, MACD lower high. Momentum is fading even as price extends.
Bullish divergence: price lower low, MACD higher low. Selling pressure weakening before price reverses.
Divergence on BTC/USDT 4H fires roughly 2-3 times per month. When it aligns with a major support or resistance zone from the chart patterns guide, these are among the cleanest setups available. Less frequent than crossovers, but with a better hit rate.
What the timeframe testing showed
MACD on the 15-minute chart is nearly useless for swing trading. The lines cross constantly. The histogram reverses every few hours. There’s no way to tell a meaningful shift from random noise. I ran enough tests to know this isn’t opinion. It’s a reliable finding.
On the 4H chart, the picture changes. You get 3-6 meaningful crossover or divergence setups per month per pair. Each signal can be evaluated properly. False signals still happen, but the rate drops to a manageable level.
On the daily chart, signals are cleaner still, though rare. For swing positions held 3-10 days, the daily MACD acts as a filter: if daily MACD is bearish, avoid new longs even when the 4H gives a crossover. The daily keeps you from fighting the larger trend.
My current setup on Exness: 4H as the primary signal timeframe, daily MACD as the trend filter. Nothing below 1H gets checked.
For how MACD fits into a complete indicator stack with RSI and price structure, see the swing trading technical analysis guide.
We post 2-3 live trade ideas every day from our $600 live account. EUR/USD, BTC, XAU/USD.
Common mistakes with MACD
Using MACD without market context. MACD confirms momentum. It doesn’t tell you whether price is near a key level, whether you’re in a trend, or whether a major economic release is two hours away. Pair MACD signals with price structure before acting on them.
Trusting every crossover. This was my $300 lesson. In ranging markets, every crossover looks like a reversal. Check whether price is making higher highs and higher lows (uptrend) or lower highs and lower lows (downtrend) first. If neither, MACD doesn’t have a direction to trade into. See swing trading strategies for how to read trend context before layering in indicators.
Changing settings constantly. The default (12, 26, 9) is a solid baseline. Some traders shift to (5, 34, 5) for daily charts or (3, 10, 16) for faster signals. Test one configuration thoroughly before switching. Fitting settings to past charts isn’t improving your strategy. It’s curve fitting.
Ignoring divergence. Most beginners focus entirely on crossovers and miss the signal with the better accuracy. Divergence fires less often and requires more chart reading skill. That combination is exactly why it’s worth learning.
Applying MACD to 15-minute charts for swing decisions. Covered above, but worth repeating: on 15min, MACD is noise. Minimum 1H, prefer 4H.
We run it on Exness Standard: EUR/USD from 0.7 pips, start from $150, instant withdrawal.
Frequently Asked Questions
What does the MACD indicator tell you?
What MACD settings should I use?
How reliable are MACD crossover signals?
What is MACD divergence and why does it matter?
Can MACD be used for crypto trading?
What is the difference between MACD and RSI?
Where can I learn more about applying MACD in a full strategy?
Reader Reviews
The trend filter point is what I was missing. I'd been taking MACD crossovers in ranging markets and wondering why my win rate was 38%. After applying the higher-high/higher-low check before every crossover entry, that number jumped to 57% over the next 30 trades on EUR/USD 4H. The filter is obvious in retrospect but I hadn't seen it stated this clearly before.
Divergence was something I kept reading about but never trusted enough to trade. The BTC 4H example — 2-3 fires per month, better hit rate than crossovers — gave me enough conviction to start tracking it on my own charts. After 6 weeks I've confirmed the frequency claim. It really does align with key levels in a way that crossovers don't.
The histogram narrowing as an early crossover warning is the most actionable insight in the article. I was always waiting for the lines to actually touch before paying attention. Watching the bars shrink first gives you a few candles of lead time to prepare the entry. Tested it on 20 trades on GBP/USD and it consistently gave earlier entries than waiting for the crossover itself.
The timeframe testing section confirmed something I'd experienced but never systematically verified. Tried MACD on the 15-minute chart for two weeks — it was noise, exactly as described. Moved to 4H and immediately the signals became evaluable. The move from 15min to 4H didn't change the indicator, it changed the signal-to-noise ratio enough to actually use it.
Leave a Review

Crypto Trader & Technical Analyst
Crypto trader since 2019. Specializes in momentum strategies using RSI, MACD, and volume analysis on Binance Futures. Has managed personal portfolios through multiple market cycles.